Analyzing Business Events
| Note to reviewers: This is an update of the Analyzing Business Events topic for Mule 3.2.1 that replaces the existing topic in the Mule 3 Users Guide. |
Today’s businesses require accurate analysis of their daily transactions and events. Mule management console provides a robust dashboard to monitor business transactions and events. Most businesses need access to information surrounding the following use case examples:
-
Root cause analysis - determine where errors are occurring.
-
Regulatory compliance - compliance to business rules, policies and standards.
-
Business activity monitoring - drill-down to monitor specific transactions.
-
Business intelligence - retrieves and analyzes your data.
Mule gives you in-depth visibility into business transactions and events on your Mule servers. This visibility is available out of the box via the Business Events tab in the management console. All transactions can be stored in a persistent database and retrieved later for integration with other applications. You can track events about the flows and message processors handling your business transactions and drill down into event-related data which provide information to help analyze the root cause of failures, isolate performance bottlenecks, and test for compliance to company procedures.
The Mule servers generate default events for the flows and message processors handling your business transactions, tracking such information as processing time and errors. For example, lets assume you have an order fulfillment application. Suppose a customer has reported that they have not received an order. You can use the business event data from the customer’s transaction to do root cause analysis of the failure.
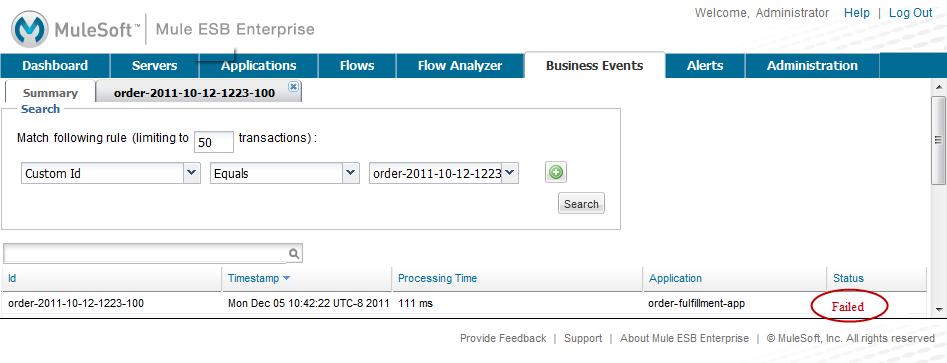
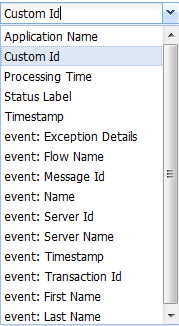
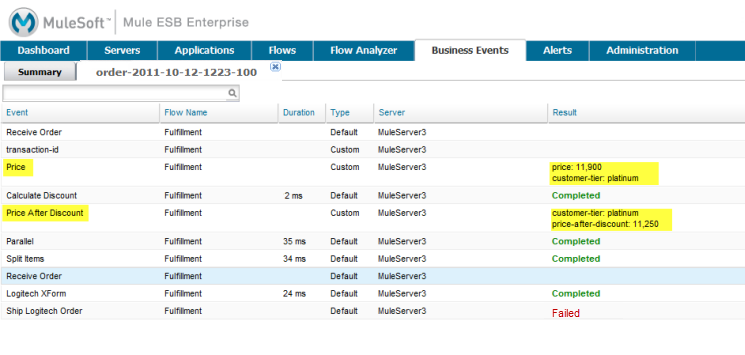
From the MMC, click the Business Events tab and the screen above appears. You can select a variable to search by clicking the drop-down box:
The example uses Customer ID to filter the Business Event data. The Customer ID is order-2011-10-12-1223-100.
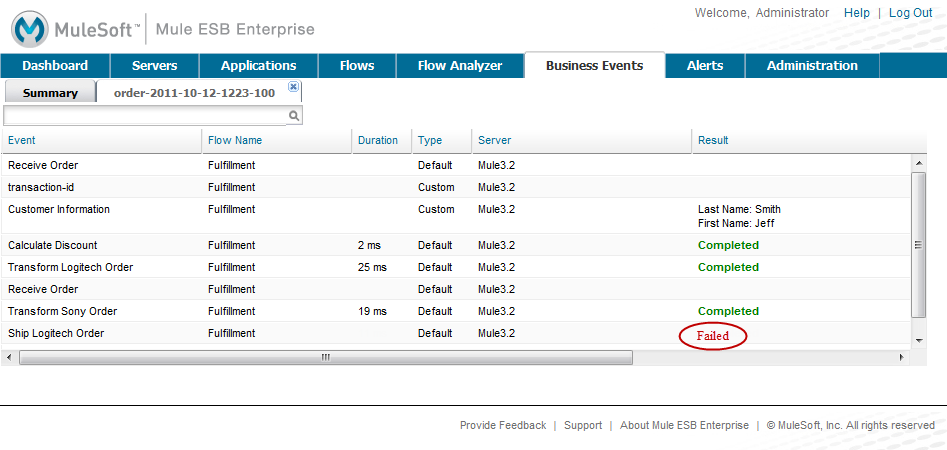
You can display data for the events generated in the flow for that transaction and identify where things failed. Drill down on the ID to view detailed event information.
For example, suppose the order fulfillment application applies a price discount depending on customer tiering. You can ensure that the discount is properly applied by defining custom events that track the price of an item before and after the discount is applied.
After you run a transaction, you can view the data for the "before" event (listed here as "Price") to see the customer’s discount tier as well as the price before the discount is applied. And you can view the data for the "after" event (listed here as "Price After Discount") to see the price after the discount is applied.
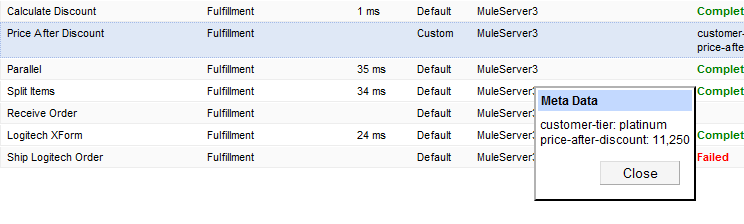
Clicking on the custom event displays the associated data in a pop-up window.
In summary, all events, regardless if they are custom or default, are stored in a database for retrieval and analysis. From the Business Events tab, the console enables you to retrieve transaction and event information. In addition, you can also audit events. Auditing events has a low overhead and minimally affects server processing.
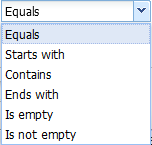
You can set up queries to select and view subsets of business transactions handled by your servers. You specify various criteria for selecting transactions, search for particular values, and apply filters to the results.
See Tracking and Querying Business Events for details on how to use the transaction and event querying and filtering features. That page also explains how you can add your own custom code to your application to enhance default event tracking.
Also see Business Events Use Cases for detailed examples that illustrate the use of the Business Events tab in a business-oriented setting.