Tracking Flows
The screens available from the Flows tab let you track the flows and services of deployed applications on a server. The Flows tab, along with the Flow Analyzer tab and its screens, are particularly helpful to diagnose problems due to performance issues and memory usage.
The Flows screens let you identify where processing is occurring and the time taken by that processing. You can see which services and flows are handling requests, and how much time it is taking them to handle these requests. The Flows tab lets you see where problems are developing, at which point you can use the Flow Analyzer tab to find out what is going on with specific message requests that might be causing these problems. By tracking and auditing a flow you can debug the flow performance and verify payload content along with message properties.
This page describes how you might use the Flows tab and its screens. See Analyzing Message Flows for details on the Flow Analyzer tab.
The Flows tab shows you information about the services and flows for applications deployed on a particular server or servers. You can see summary, high-level information about event processing for application flows and services. You can also drill down for more detailed information.
Flows Summary Information
When you have applications deployed and running on the server, go to the Flows tab to track information about these applications. When initially clicked, the Flows screen displays a table listing all flows and services for all applications currently deployed on the selected server or all servers. Since you may want to see only certain applications or some set of flows or services, use the search box to narrow the display to a more manageable subset (such as by application, id, type, status, or audit). You can also sort the table by values in any column; just select the column and from the pull-down menu, choose ascending or descending order.
The figure below shows an example of the Flows screen.
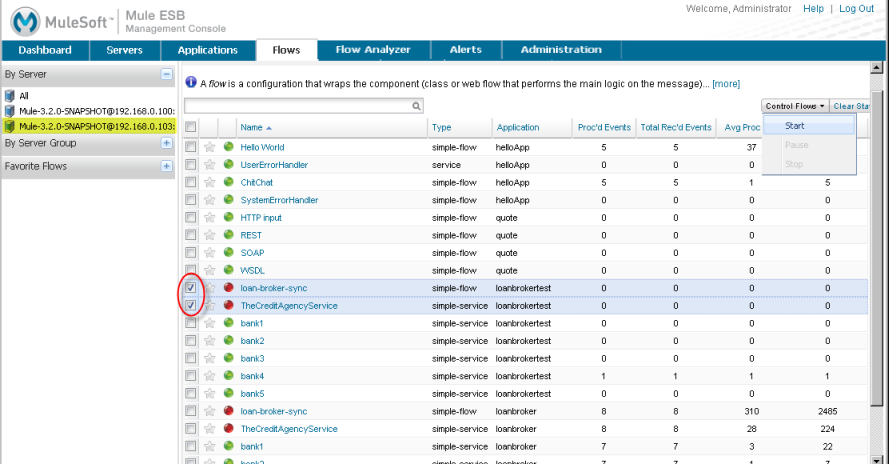
In this example, the screen displays all the flows for one server, shown highlighted in the navigation bar. At a glance you can see essential information about each flow or service: the name of the flow or service, its type, its application, along with the number of events processed by the flow/service and the number of events it has received. You can also see the average time it took the flow or service to process an event and the cumulative or total event processing time (the column heading is obscured in the figure) for all events handled by that flow/service.
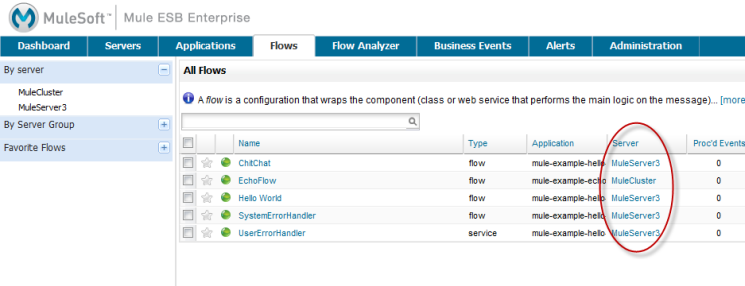
[mmc:Mule 3.2] The Flows screen also displays which server is associated with each flow or service.
Starting and Stopping Flows
Notice that several of the flows/services are marked with red circles rather than green circles. A red circle indicates that the flow is stopped or paused whereas a green circle indicates it is running. You can start paused or stopped flows, or stop or pause running ones, by selecting them and then clicking the appropriate option from the Control Flows button. In the example above, you can see that two stopped flows are selected since there are check marks in the box to their left and the Control Flows button option to start them is the only available option.
You can select and control whether flows are paused or running from this initial screen and also from subsequent screens if you drill down for more information, since the Control Flows button appears throughout the detailed screens.
If you intend to analyze a flow, make sure that it is running before going to the Flow Analyzer tab.
Clearing Messages and Stats
As you monitor applications and flows, you may very well want to clear out previously tracked data and start fresh. By doing so, you can set up test conditions and then collect data to see how these conditions affected performance.
Clearing previously traced data is easily done with the Clear Stats button. As with the Control Flows button, first select the flows and services you want to clear, then click Clear Stats. A dialog appears asking you to confirm the operation. If you click Yes, then the statistics for the selected flows/services are reset to zeros.
Similar to Control Flows, you can clear statistics for flows from this initial screen and from subsequent, more detailed screens.
Getting More Detailed Information
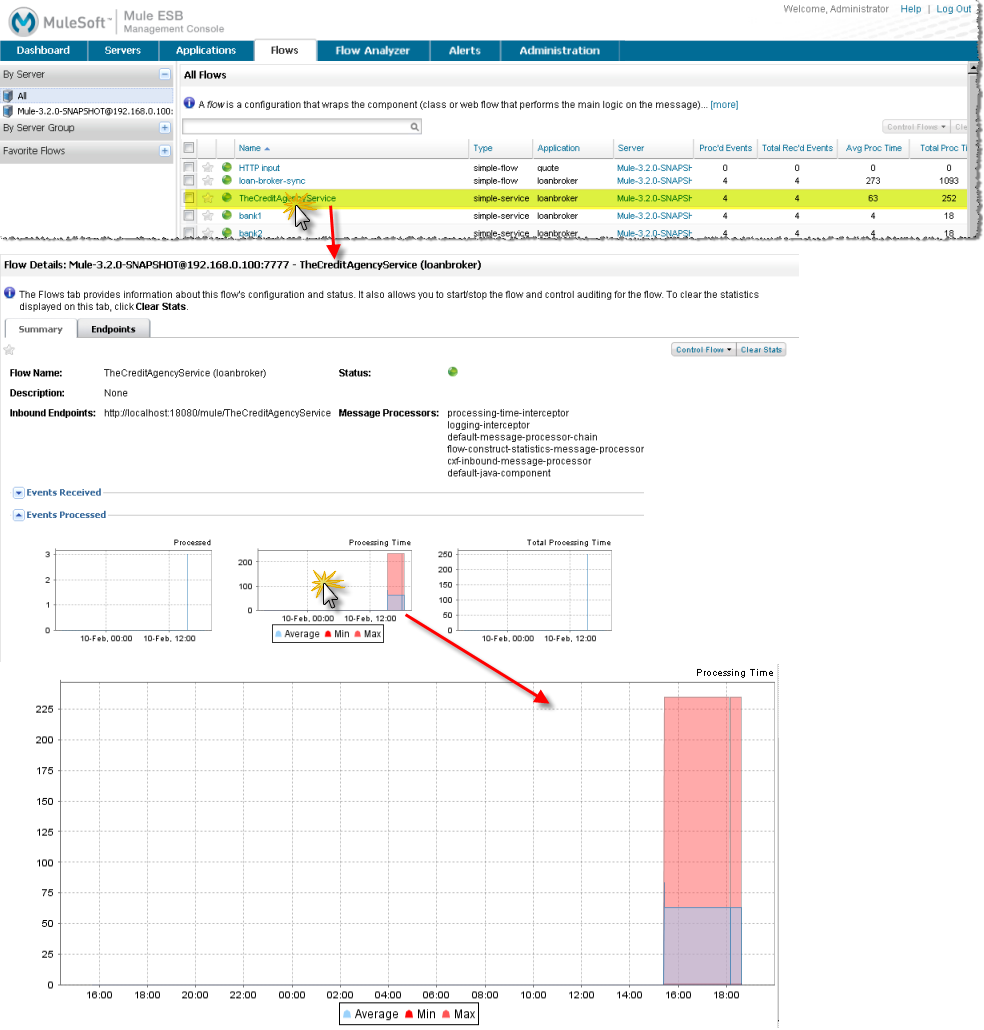
Click the name of a flow or service and the console displays a screen with more detailed information about that flow. The Summary tab, which displays first, gives you complete information about the selected flow or service. You can verify the flow or service details.
You can check that the flow or service has the expected message processors, and that the endpoints are correctly set up. The charts for events received and processing time help you pinpoint if processing bottlenecks are occurring all the time or only at certain times. Remember that you can expand any of these charts by clicking within the chart. When you have finished examining the expanded chart, click inside the chart again so that it returns to its smaller size.
The figure below shows you might use the Flows screens to track events processing on a flow. Get detailed data by clicking the service from the summary table, then expand the event processing chart to see when the event processing occurred and how the time was apportioned.
When you see that there’s a problem with a flow or application, switch to the Flow Analyzer tab to track the flow and trace the problem further. See Analyzing Message Flows.