Analyzing Flow Processing and Message Payloads
Use the Flow Analyzer tab to view and analyze real-time information about messages that the flow is processing. This tab displays the message payloads, both before and after processing, plus information about the flow message processors and message meta-data properties. Before attempting to analyze a flow, use the Flows tab to be sure that the application flow is running.
| Flow analysis is not available for clusters. It is primarily a development-time tool. However, you can use it on a standalone server running an application that you plan to deploy to a cluster. |
Once you understand the basics of the Flow Analyzer screen, described on this page, follow the links below to delve further into this topic:
-
Tracking Flows - Provides more information on using the Flows tab and setting up flow tracking, a prerequisite for flow analysis.
-
Analyzing Message Flows - Takes you through using the Flow Analyzer panes in detail.
-
Debugging Message Processing - Illustrates the general steps for debugging an application’s message processing.
-
Debugging the Loan Broker Example Application - Shows how to use the console Flow Analyzer screen to find an application logic bug.
-
Using Message Processors to Control Message Flow - Provides reference information for the available Mule message processors or routers.
Select Flows for Analysis
When the Flow Analyzer screen first opens, it is initially empty. You first define the parameters for selecting the flow(s) of interest. To do so, you first select the server, then the application(s) deployed on that server, followed by the selected application’s flow(s) to populate the screen with messaging data. See the figure below.
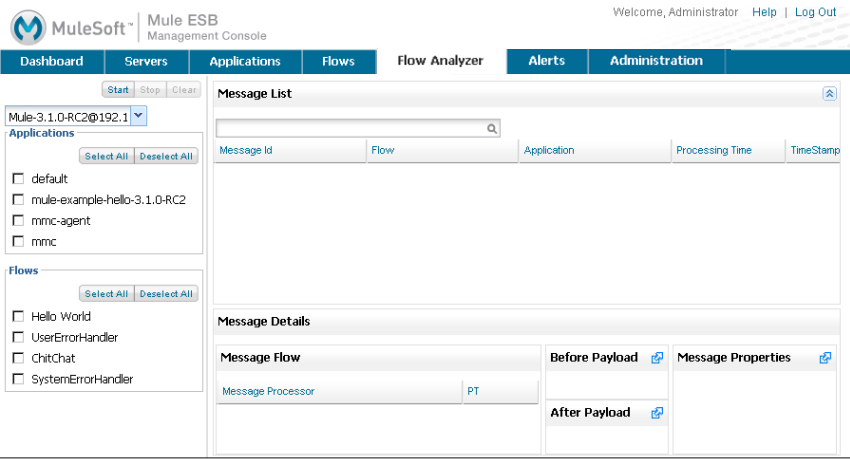
Make your selections from the server, application, and flow selection tree on the left side of the screen. First select a server from the pull-down list. Once the server is selected, you see a list of all applications and flows running on the server. Click one or more (or all) applications. Similarly, you select one, several, or all flows. Once you have made these selections, click the Start button to start the flow analysis process.
View Flow Summary
After you make your selections and click Start, the top portion of the screen displays a list of message identifiers, plus indicates the application and flow to which the message pertains, and shows the processing time and time of occurrence.
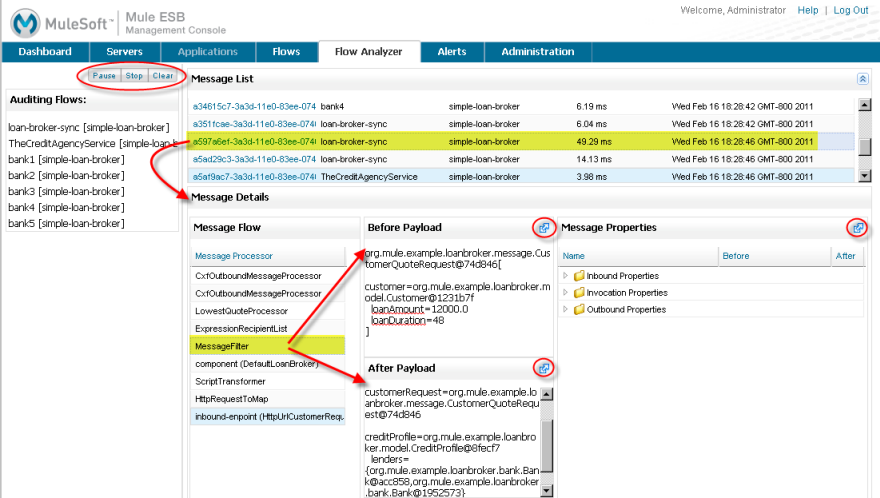
Click the buttons in the upper left corner to start, stop, pause (or continue if currently paused), the flow analysis process, or to clear collected information.
The Message List table displays the summary details about the flow messages you are analyzing. It includes the following:
-
ID: The message identifier.
-
Flow: The flow on which the message occurred.
-
Application: The application on which the message occurred.
-
Processing Time: The amount of time spent to process the message.
-
TimeStamp: The exact time the message was generated.
Select a message from the Message List (click anywhere on the message line) and the lower half of the pane displays details about the processing of that message, including information about the message processors, before and after payload values and details, and message properties.
View Message Processors and Messages for Flows
The Message Flow pane lists the message processors handling the selected message. Typically, there are multiple message processors for one message. The two payload panes (Before Payload and After Payload) and the Message Properties pane are synchronized with the Message Flow pane. That is, the payload and properties panes display detailed data for the selected message processor in the Message Flow pane.
Click the expand arrow icon (circled) in the Message Properties title bar to open a more detailed pane with just the inbound, outbound, and invocation message properties, as shown in the figure below. Use the right arrows to the left of these top-level message property entries (circled in the figure) to expand and contract the property details. (You can also expand and view message property details directly where they appear in the lower half of the pane.)
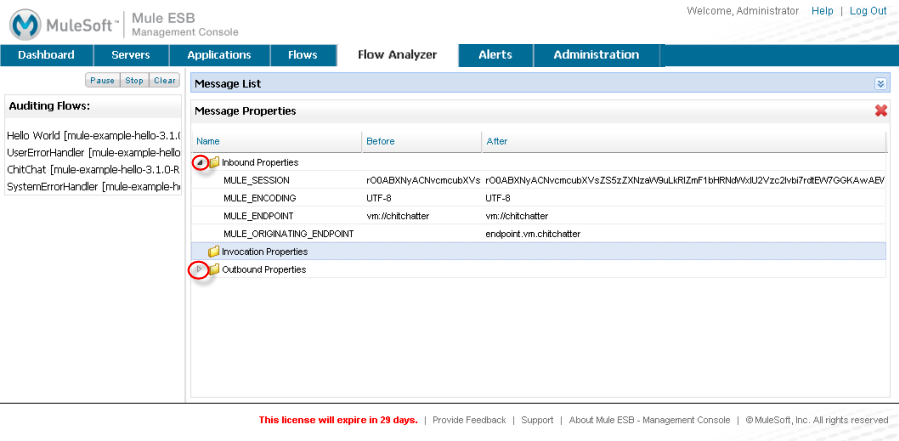
Click the red X to close this detailed view of message properties and return to the full audit screen.
Similarly, you can expand the before and after payload panes, which you might do when you have complex payloads. You close them and return to the full audit screen in the same manner, by clicking the red X.
Viewing Message Payload When Using Streams
When analyzing a flow, it is possible to see the details of a SOAP request that uses streams for CXF endpoints.
Keep in mind that the analysis functionality is designed to not modify message payloads as they move through the system. This design ensures that your system always functions as tested and that analysis functionality is safe when used in a production environment.
However, when you use streams, analysis functions somewhat differently. When streams are used, the system does not read the stream into memory since large messages might potentially cause problems. Instead, the system passes basic information about the stream type.
You can modify your application to use an object-to-byte-array transformer so that it does not use a stream for CXF endpoints. By doing so, you avoid the limitation imposed by streams and memory. Below is an example configuration for an inbound end point for doing this. Note that the same configuration applies to outbound endpoints as well.
<object-to-byte-array name="ObjectToByteArray"/>

<cxf:inbound-endpoint address="....." transformer-refs="ObjectToByteArray" response-transformer-refs="ObjectToByteArray"/>