Analyzing Message Flows
Shift to the Flow Analyzer tab after verifying (via the Flows tab) that your application processes are running and identifying possible problems.
The Flow Analyzer tab enables you to see the cause of many problems and gives you insight into how to fix them. (Be sure that the flow you want to analyze is started and running. Use the Control Flows button from the Flows tab if you need to start a particular flow. See Tracking Flows for more information on the Flows tab.)
| Flow analysis is not available for clusters. It is primarily a development-time tool. However, you can use it on a standalone server running an application that you plan to deploy to a cluster. |
System administrators and developers alike will find the Flow Analyzer screens particularly useful for diagnosing problems, such as memory and performance bottlenecks. You use the Flow Analyzer tab to verify message payload content and message properties for flows. You can see the processing trail that a message takes, the message payload at each processing step, and debug the flow performance.
Developers in particular will find it useful to delve into payload content at each point in the message processing. They can not only see if the payload is as it is intended, but they can also look at the associated message properties at each point in the processing. Furthermore, when debugging an application, developers, if they need to see the complete payload for certain types of messages, have the option of turning encryption off or using other special transformer tools to decrypt messages.
This topic takes you through the basic steps for using the Flow Analyzer tab. In a nutshell, you:
-
Define the selection parameters for a flow - Select the server, application(s), and flow(s) to track or audit.
-
Start the data collection process
-
Control data collection - Use Pause/Continue and Clear buttons to control the collection of flow messages.
-
Search the message list - Find specific messages of interest.
-
Select a message id for details - View message details.
-
Examine the message content and navigate the message processors - Learn what is key about the message content and how to navigate them.
Define Selection Parameters
Before you can analyze a flow’s message payload, you need to define the flow selection parameters. You select the server, application, and flows within the applications, then explicitly start collecting the message processing data. The management console starts collecting data when you click the Start button, accumulating information about the message payloads passed among the application’s flows. You can examine the message payloads even as data collection continues. At any point, you can pause or stop the collecting process, or clear out the collected statistics to start with a clean slate.
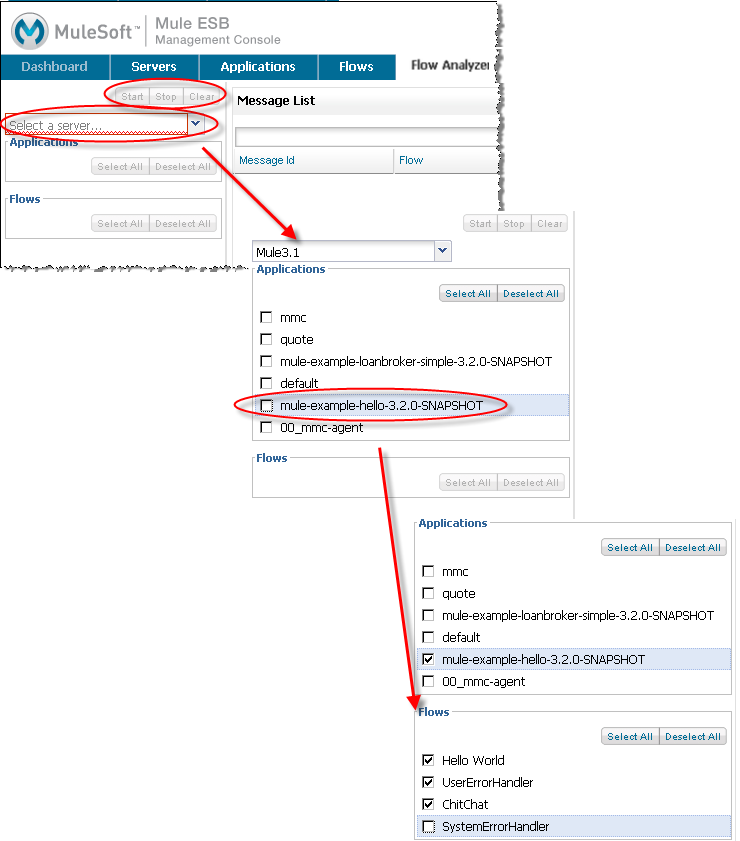
Suppose you want to look closely at the hello world example application, which you have deployed on your server. You have verified that the application flows have been started. Click the Flow Analyzer tab and define the parameters in the left pane. Select the server first from the pull-down list. After selecting the server, the pane expands and displays all applications running on the server. Click the applications to track, then the Flows section expands and displays all applicable flows. You can select all flows or individual flows. The figure below shows how the pane changes as you make your sequence of selections.
Start Data Collection
When all selections are complete (server, application, flows), be sure to click the Start button, which will no longer be grayed out, to start collecting messaging data for analysis.
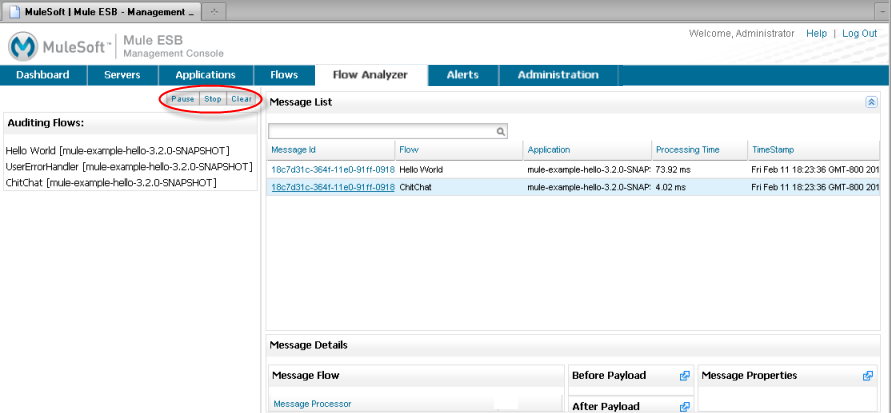
Once you start data collection, the selection pane displays the list of flows currently being tracked. The Message List panel in the center displays a table listing identifying and summary information about each message payload in the order they are processed.
Control Data Collection
At any time, you can click the Pause button and pause tracking (that is, suspend the collection of message processing data). You might do so when you have collected a sufficient amount of data for your debugging purposes. When you pause data collection, the Pause button changes to Continue. Click Continue at any time to resume data collection from a paused state. When tracking is resumed, processed messages are added to the end of the previously collected message list.
Click the Stop button to completely stop the tracking process. Use the Stop button when you have completed a particular tracking session. You can start a new data collection with different parameters or restart the collection with the previously entered parameters. However, unlike resuming from a paused state, previously collected messages are no longer available.
Click the Clear button to clear out messages in the message list. Data collection continues without a pause and new messages are added to the list.
Search the Message List
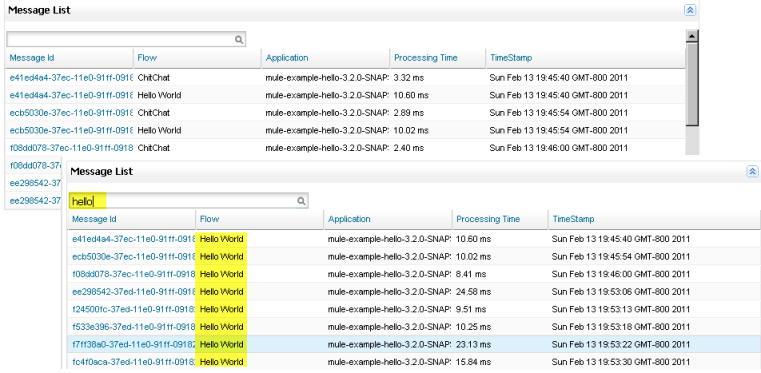
Very likely, the application you are auditing will have a multitude of messages. Use the Search box to filter the list of messages and narrow the display to the messages of interest. Start typing a filter string in the Search box and the Message List changes to show only matching messages. Erase what you have typed in and the display again lists all messages.
The figure below illustrates narrowing the message list display to flows that match "hello".
Get Details About a Message
To get detailed information about a message, click a particular message payload in the table. The Message Flow section (in the Message Details section in the lower half of the screen), displays the message processors for that message.
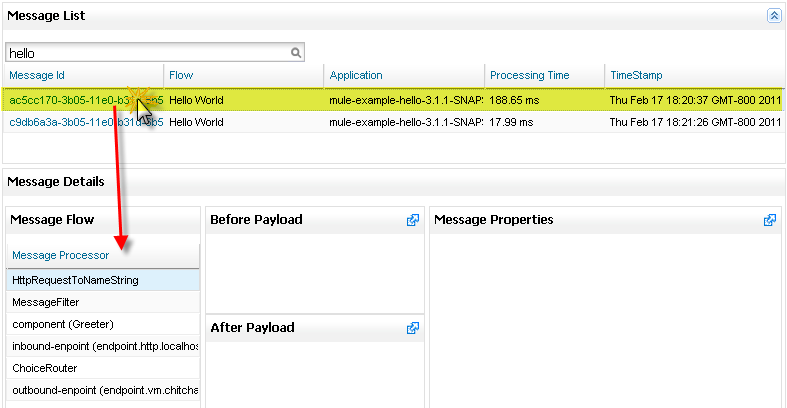
Select a message processor from the Message Processor list. The other Message Details panes display detailed information. For example, after clicking a message in the list, these panes display data pertaining to the selected message:
Understanding the Message Processors and Message Content
The Message Details panes give you detailed information about the message processors, the message payload data, and message properties. These panes are in sync with the selected message processor in the Message Flow pane. Each detail pane can be expanded, making it easier to view all the data in the pane.
The Message Flow pane shows the message processors that act on the message as it moves through the system.
You use the Message Flow details pane in conjunction with the other message detail panes to navigate the message processors. When you click a processor in the message processor list, the two payload and message properties panes sync up with the selected processor. This enables you to examine the selected processor’s before and after payload content and look at its three types of message properties.
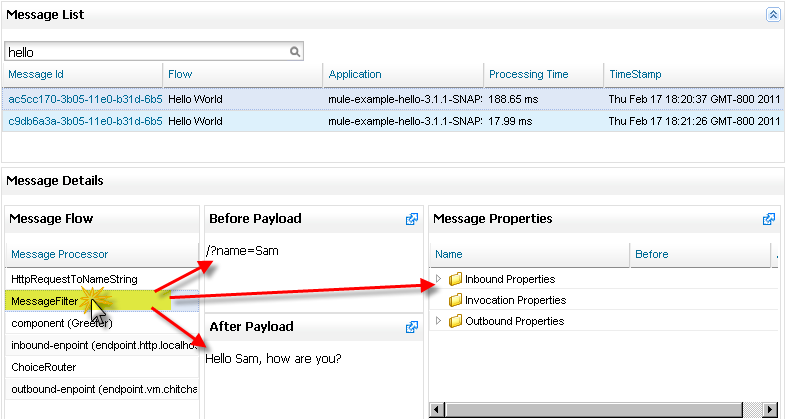
For example, the figure below shows the before and after payloads, along with an expanded Inbound Properties folder, for the highlighted processor.
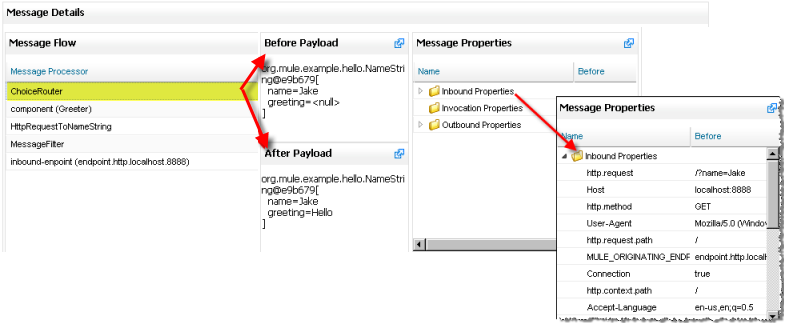
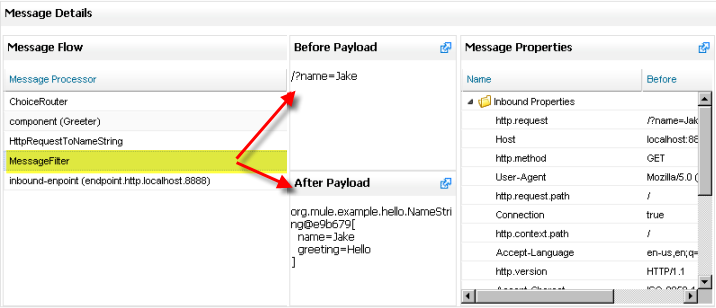
The next figure shows different before and after payloads and message properties when a different processor is highlighted.
Message Processors
An application uses message processors to control message flow; that is, to control how messages are sent and received within a flow.
Looking at the Message Processor list in the previous figures, notice the ChoiceRouter message processor. ChoiceRouter is an implementation of the standard Choice router. Its function is to send a message to the first matching message processor. MessageFilter is also an implementation of the standard Idempotent Message Filter, which filters out duplicate messages using the message ID.
See Using Message Processors to Control Message Flow to find out more about these standard message processors and how to use them to control message flow.
What’s in the Payload Data
The payload data shows the business-related content of the message. For example, for an order entry application the message payload might be a product number or an actual sales order. For the simple hello world application, the payload is the name of the individual entered via the browser.
There are two parts to the message payload panes: Before Payload and After Payload. The Before Payload pane shows the message content when the message is received by the processor node and the After Payload pane shows the payload when the message exits the node. The payload data indicates how transforms are being applied. You need to look closely at the payload data itself to ensure that the application transforms are working properly.
As noted earlier, message data may be encrypted for security reasons. Although not possible in production, during the debugging phase of development it is possible to access sensitive or encrypted message data. For example, the payload may be streamed data, which is unreadable as is, or object data. You can read streamed or encrypted data by either temporarily turning off encryption, using an object-to-byte-array transformer, or using some other third-party transformer or decryption tool.
For more information on reading stream-based payloads, such as CXF streams, see how to apply an object-to-byte-array stream transformer in the section "Viewing Message Payload When Using Streams" in the Analyzing Flow Processing and Payloads topic.
Message Properties
The Message Properties pane contains three sets of message properties: Inbound, Invocation, and Outbound properties. These message properties are the meta-data used, in part, to control the message flow through the system. These message properties also determine message routing, end point invocations, and so forth.
The figure below is an example of message property meta-data. (Note that some properties have been removed from the figure.) A message’s properties differ depending on its particular configuration.
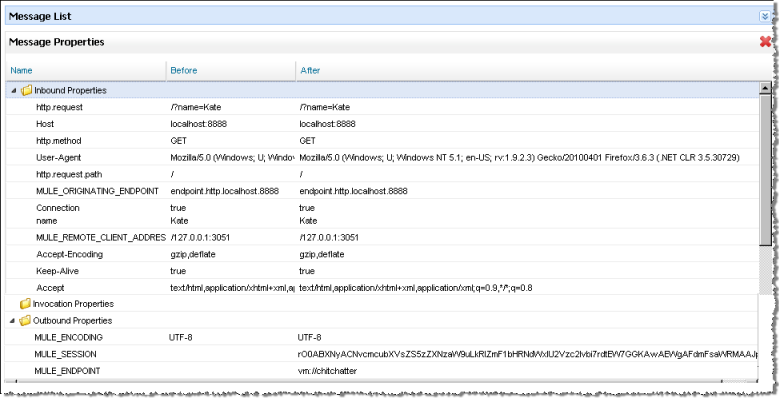
You need to look at the message properties to diagnose routing issues and potential third-party issues, such as if end points are not correctly invoked.