Defining SLAs and Alerts
Use the Alerts tab to view raised alerts and to define new alerts, or edit existing alert definitions.
From the Alerts screen, click the Alert Definitions node in the navigation tree to see all currently defined alerts. From this pane, you can create new alerts and edit details about existing alerts. The figure below illustrates the details pane for creating and managing alerts. The pane displays a summary of the existing alerts and provides buttons for adding new alerts, controlling alerts (activating or disabling selected alerts), and deleting them.
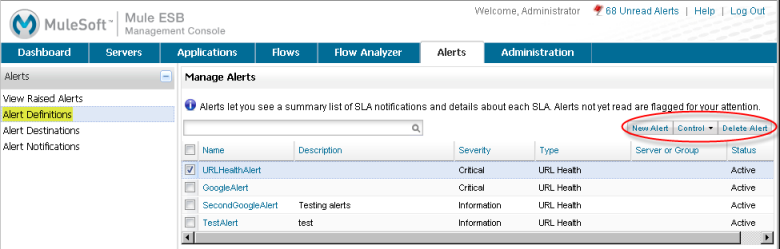
The Manage Alerts pane lists all currently set alerts and displays the following information about each alert:
-
The name of the alert
-
A description of the alert
-
The alert severity level (Fatal, Critical, Major, Minor, Information)
-
The type of the alert (such as Low Memory, Server Down, Server Up, Thread Pool SLA, URL Health). You can also have alerts based on custom expressions.
-
The server (or server group) for which the alert applies
-
The current alert status (Active, Disabled).
To create a new alert definition, click the New Alert button. To manage existing alerts, click the alert alert’s checkbox. Use the Control button to either activate or disable the selected alert(s). Use the Delete Alert button to delete the selected alert(s). Before alerts are actually deleted, a dialog prompts you to confirm the deletion.
Click an alert name to view and edit the details for that alert.
Note: Currently, low memory alerts are not supported in an OpenJDK environment.
Creating an Alert Definition
Click the New Alert button to create a new alert. The Add Alert pane displays a Type field. From the Type field’s pull-down list, select the alert type (Custom Expression, Exception, JMX Attribute, Log Regex, Low Memory, Server Down, Server Up, Thread Pool, URL Health).
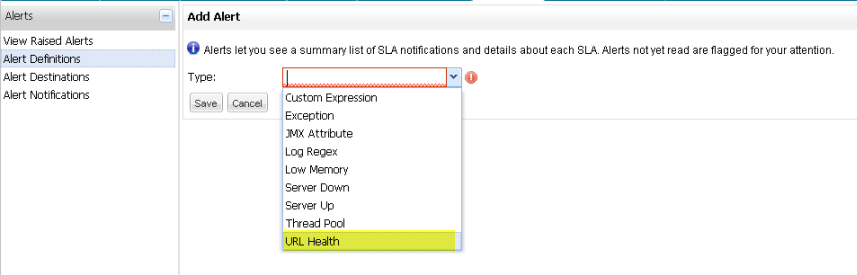
Once you select the alert type, the pane expands to display additional fields to which you enter data describing the alert. Different alert types have different data fields. The Add Alert pane displays the appropriate fields for the alert type you selected and you then enter the required and optional data. (Note that most fields are required. If you omit data for a required field, the console highlights that field in red.) Where possible, the console supplies default values and you can change these or leave as is. You must also click Save when you have finished defining the alert conditions.
For example, the following figure shows the Add Alert pane for the Server Down alert type.
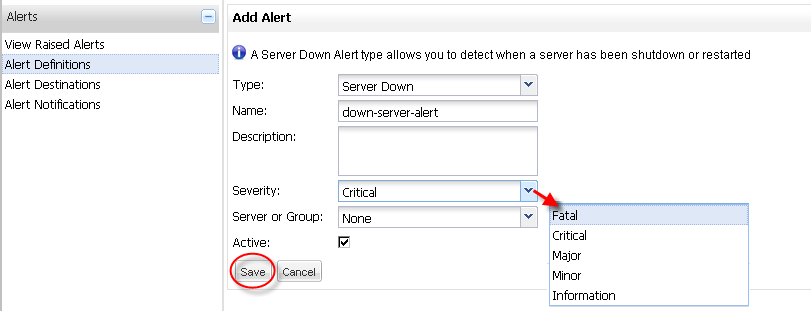
Enter a name for the alert and, optionally, a description. From the Severity pull-down list, select the severity level (Fatal, Critical, Major, Minor, Information) of the alert. For the Server or Group field, select the server or group to which the alert applies (the default is none), and then check if the alert is active.
A field for which data is required is marked with an exclamation point  and highlighted in red if left blank. (The figure below has a field marked as required.) For more information on these fields, see below.
If you want to create your own custom alert, select Custom Expression and then complete the appropriate fields (such as the target object expression and type, the target value expression, threshold expression, batch size, among other fields) to define the alert condition.
Note, too, that the set of entry fields change depending on the type of the alert. For example, for a low memory type alert, you are prompted for the following data, as shown in the figure below. In addition, default values may appear in some fields depending on the type of alert. For low memory alert types, the severity field defaults to Critical. You can change the severity level. You can have the alert apply to any memory pool or select a specific memory pool from the list. The Threshold Ratio is also required (note that it is highlighted in red and marked with a red exclamation point) since this field is required for this type of alert.
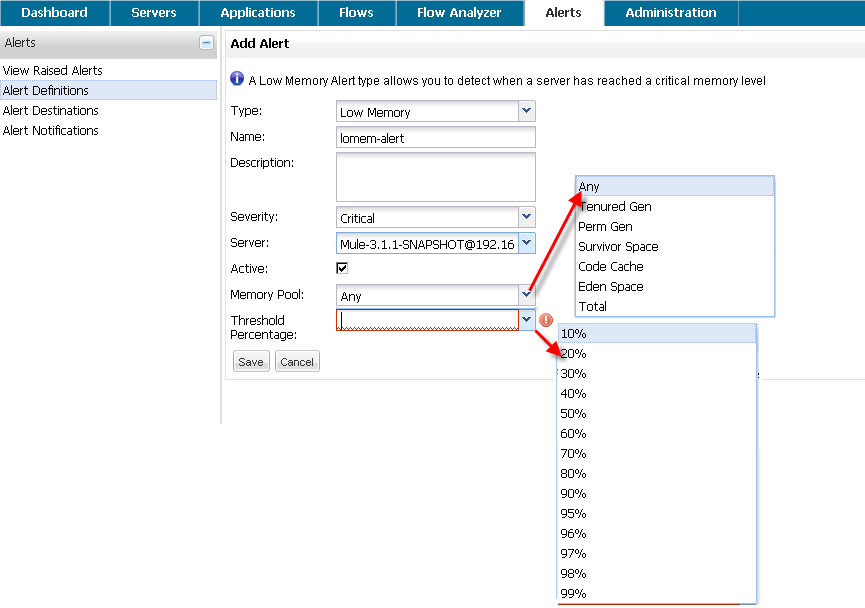
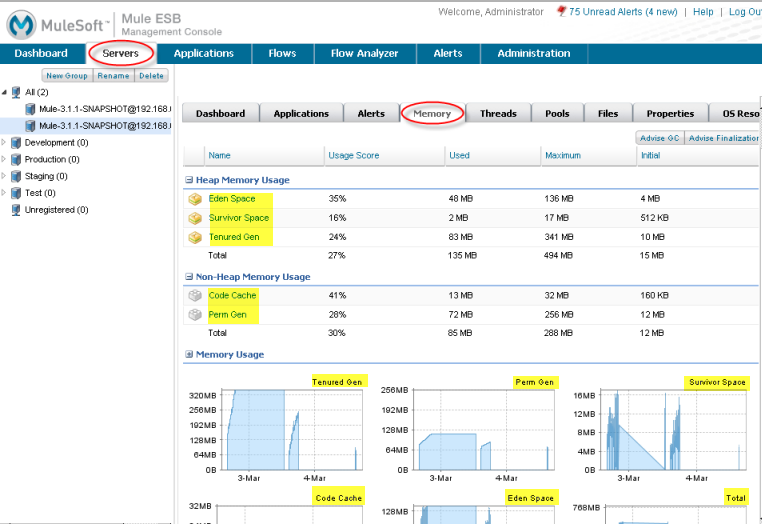
The Memory Pool pull-down list includes all memory pools for the server. To see this yourself, click the Servers tab, then the Memory tab. (See the figure below.)
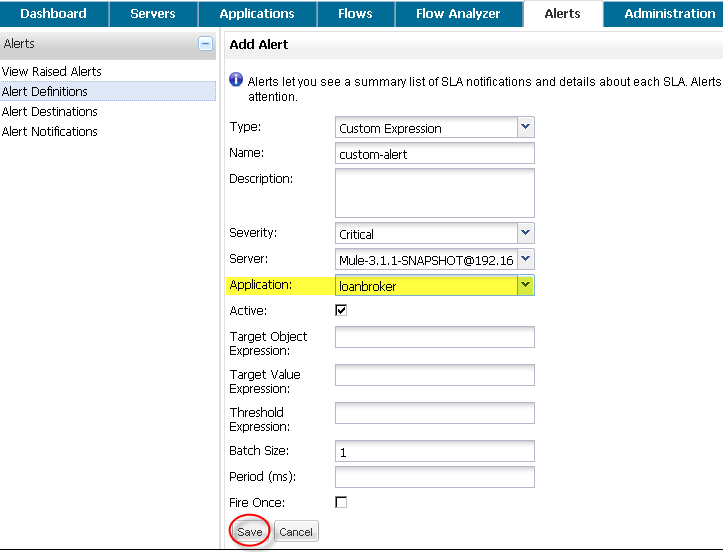
By contrast, for custom expression alert types, you are prompted for the following data, as shown below. Notice that for this type of alert, after you select the server, you can then use the Application field pull-down list to optionally select an application running on that server to which you want the alert the apply. (See Custom Alert Type Fields below for more information.)
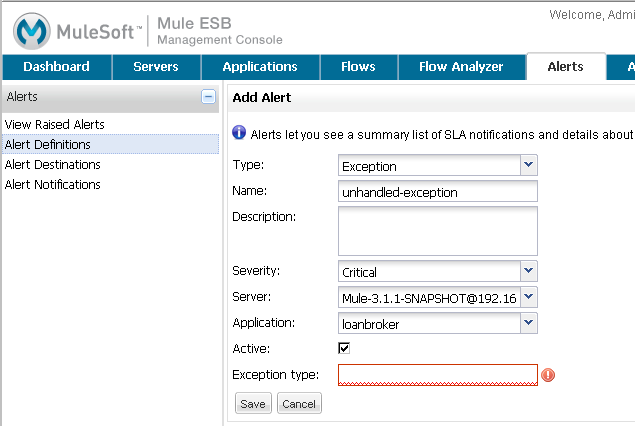
The figure below shows a sample entry for an Exception alert type. Once you select Exception for the alert type, the screen expands and displays the additional fields of data you must enter. Both the Description and Application fields are optional, but you must select or enter data for the other fields. Click Save to save the new alert, or Cancel to quit without saving the alert. (See Exception Alert Type Fields below for more information.)
Editing an Alert Definition
Click the alert name in the Manage Alerts summary pane. The pane displays the data previously entered for the alert, in the same format used for creating an alert, and you can make the desired changes.
Note that you cannot change the name of an alert. If you need to change the name of the alert, you should delete it and re-create it with the new name.
The sections below provide more information on how to set up alert fields.
Alert Data Fields
The following sections explain the data you might select or enter for particular fields when setting up different types of alerts.
Common Alert Fields
As explained previously, different alert types may prompt you for different data fields. Most alerts, regardless of type, include the following generic fields:
-
Fire Once - When this field is checked, an alert is raised once the specified condition is met. However, any subsequent triggers do not generate a new alert. When the monitored value falls below the alert threshold level, the console considers the alert to be reset. At this point, the console allows new alerts to be raised again.
-
Period (ms) - This field indicates the polling interval in milliseconds for checking a value against a threshold. The Period field effectively defines the precision and responsiveness of your monitoring solution, especially when you use it with the Batch Size field. However, keep the following trade-off in mind: the more frequently you monitor a value the greater the impact the monitoring overhead has on your system. You should be careful to not set the polling interval too low.
-
Batch Size - This field provides for a 'dampening' of values that might be oscillating around the threshold. Set Batch Size to an integer value. Setting Batch Size to a value of 1 or lower disables the dampening completely; that is, an alert is raised every time it is triggered according to the remaining set of rules. Otherwise, setting the Batch Size to a value greater than 1 raises an alert only after the threshold has crossed the batch size number of times in a row. For example, consider a scenario where you set Batch Size to 3. In this scenario, it raises an alert only after the threshold is crossed three times in a row. If two breaches occur and then the value drops below the threshold level, no alert is raised.
Note: Period and Batch Size are coupled together, since checks are performed only at poll time. That is, there is not a constant stream of updates.
Here’s a simple formula or rule of thumb for computing the Batch Size and Period values: (batch size * period) = (dampening period in milliseconds)
For example, here’s how you might apply this formula. Suppose you want to be alerted if the flow has been under high load for over one minute. You might model this as a Period value of 20,000 and a Batch Size value of 3.
Custom Alert Type Fields
Custom alerts are executed as Groovy script snippets. The execution context is exactly the same as for other scripts in Mule. The context bindings for these scripts are described in Script Context Bindings.
When creating a custom alert, you need to set the following fields:
-
Target Object Expression - A Groovy expression to obtain a reference to the object whose properties are to be checked next. For example:
registry.'threadpool.MyFlow'. Here,'threadpool.MyFlow'is the key for a flow thread pool in the registry. (Note that quotes are used to escape a name that has dots in it.) Keep in mind that the reference look up is not limited to the registry. For example, you might use a static reference to a custom cache object. The only rule you must follow is to use a fully qualified name (FQN) for the class. -
Target Value Expression - A Groovy expression to calculate the actual value to use for the check against the next threshold. Note that the object is available as a
payloadvariable for this field. For example,payload.activeTasksCountqueries the thread pool for the number of tasks physically executing at this moment in this pool. -
Threshold Expression - A Groovy expression to calculate the value of the high threshold level to check against. For example, the following expression would dynamically consult a thread pool’s threading profile and then would set a threshold at 50% of its capacity (the result is truncated to drop any fractions):
(registry.'threadpool.MyFlow'.threadingProfile.maxThreadsActive / 2) as Integer. Note that Threshold Expression may simply be set to a static value. However, be sure that the value you use does not contain any fractions.
You should also check the Pools tab in the Management Console for the actual pool names for your instances.
The example given for Threshold Expression is a very simplified example of a bundled Thread Pool Alert in the Management Console. You should feel free to explore the full power of using Groovy and Mule together.
Exception Alert Type Fields
Exception alerts allow you to intercept exceptions thrown in your Mule application.
When creating an exception alert, you need to set the following field:
-
Exception Type - A fully-qualified class name (including package) that identifies the exception type you want to intercept. If desired, you can provide wildcards (\'*') to match packages (ie com.foo.*). An alert fires only for matching exception types (that is, there is no hierarchy support).
Properties Used in Alert Expressions
There are a number of properties whose values you can incorporate into alert destinations and notifications. You incorporate these properties using the expression syntax shown above. Some properties are common to all alert types, while others pertain to specific alert types.
The following properties are common to all alert types. (The class com.mulesoft.console.alert.RaisedAlert contains the declaration of alert properties.)
| Property | Description |
|---|---|
id |
Flow identifier |
name |
Flow name |
serverId |
Server identifier |
serverName |
Server name |
description |
Description of the raised alert |
timestamp |
Time when the alert was raised |
source |
Source of the raised alert |
severity |
Severity of the alert, such as Fatal or Critical |
type |
The type of the alert, such as Low Memory or Exception |
Certain alert types have other accessible properties in addition to the common properties shown above. The table below shows the alert types for which additional properties are defined and the specific properties.
| Alert Type | Property | Description |
|---|---|---|
Exception Alert |
||
exceptionMessage |
A short text message describing the exception |
|
exceptionFullMessage |
A complete or full text message describing the exception |
|
exceptionRootCause |
The cause of the exception |
|
Threshold-based Alert (may be a custom, thread pool, or JMX alert) |
||
actualValue |
The value that caused the alert to be raised |
|
threshold |
The threshold value at which point the alert is raised |
|
thresholdEventType |
The type of the event raising the alert |
|
URL health Alert |
||
urlStatus |
The error status identifier from the URL |
|
urlMessage |
The error message from the URL |
|
Log Alert |
||
logFile |
The log file name |
|
logLine |
The line in the log file |