Monitoring a Cluster
-
[Determining a Cluster Status]
-
[Getting Details About a Cluster]
You can use the management console to monitor the status of a cluster and get detailed information about a cluster such as which flows are running or stopped, and determine memory usage.
Determining a Cluster Status
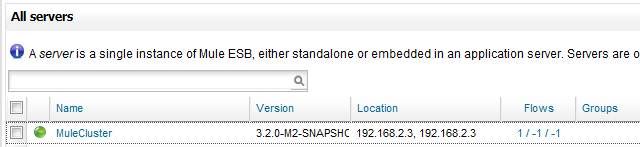
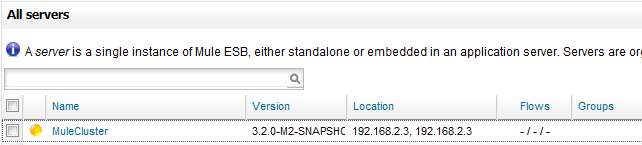
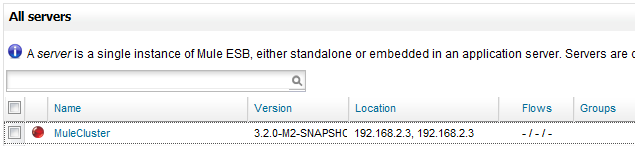
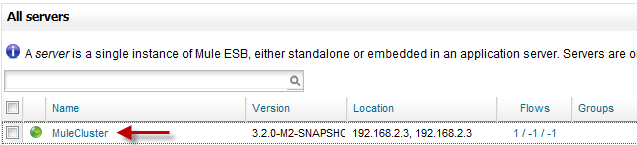
Click the Servers tab. A color-coded status icon in the All servers pane lets you quickly determine whether all, some, or none of the nodes in a cluster are running.
-
All cluster nodes are operational - If all modes in cluster are running, the cluster status appears as a green icon.
-
Some cluster nodes are operational - The status icon is orange if some but not all nodes in the cluster are running.
-
No cluster nodes are operational - The status icon is red if none of the nodes in cluster are running.
Getting Details About a Cluster
Click a cluster in the All servers pane to get details about that cluster.
This opens the Cluster Details pane from which you can get cluster node details, cluster metrics, and status information about deployments to the cluster.
Cluster Node Details in the Dashboard Tab
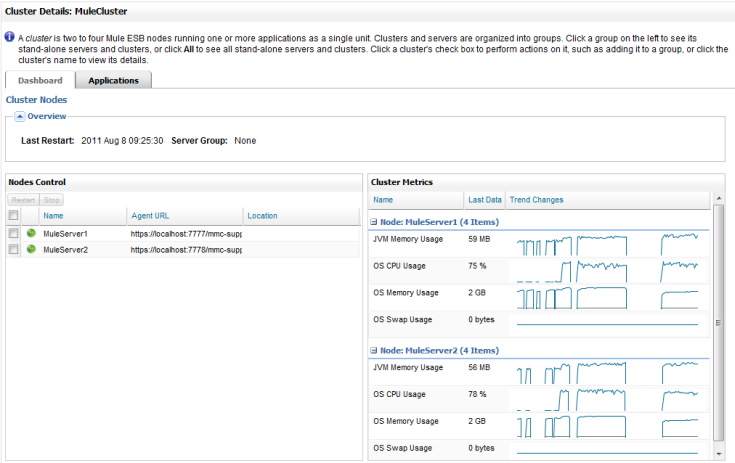
The Dashboard tab in the Cluster Details pane provides overview information about the cluster as well as Nodes Control and Cluster Metrics portlet. The overview information includes the date and time the cluster was last started. It also lists any groups to which the cluster was assigned.
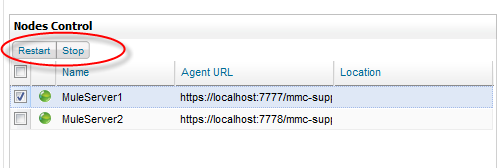
The Nodes Control portlet lists the nodes in the clusters. The color-coded status icon next to the node indicates it status (green: operational, red: not operational). You can stop or restart a node by clicking its check box and then clicking the Stop or Restart button in the portlet. The Restart and Stop buttons are enabled in the portlet when you check the check box for a node.
The Cluster Metrics portlet tracks JVM memory usage, CPU memory usage, and OS Swap usage for each node in the cluster.
Deployment and Application Status in the Applications Tab
The Application tab in the Cluster Details pane provides a Deployment Status portlet and a Cluster Application Status portlet.
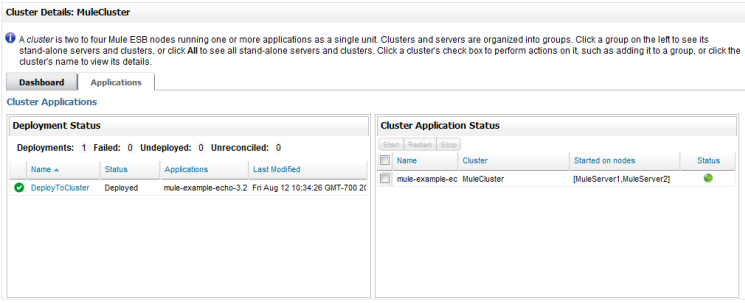
The Deployment Status portlet displays the status of all deployments to the cluster.
The Cluster Application Status portlet displays the status of individual applications deployed to the cluster. You can start, restart, or stop an application by clicking its check box and then clicking the Start, Restart, or Stop buttons in the portlet.
The Deployment Status and Cluster Application Status portlets are also available in the management console dashboard.
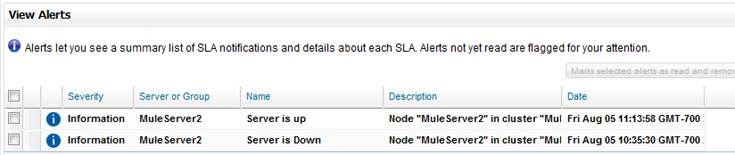
Cluster Alerts
You can also monitor the availability status of the node in a cluster by creating a server up or server down alert for a cluster. Create the alert as described in [Creating an Alert Definition] and select the cluster in the Server or Group field.
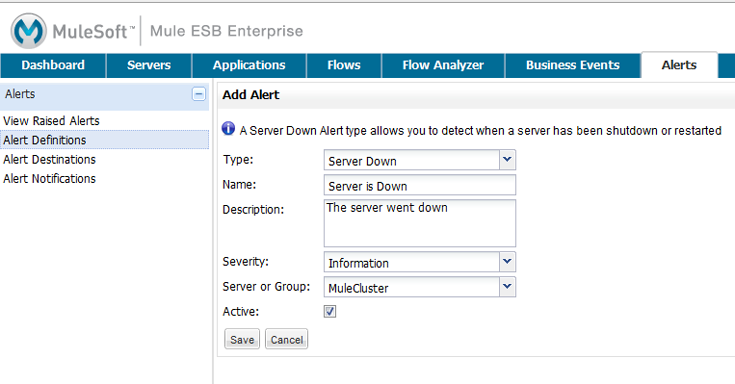
If you create a server down alert for the cluster, an alert is raised if any node in the cluster goes down. If you create a server up alert for the cluster, alert is raised if any node in the cluster goes back up.