Tracking and Querying Business Events
The Mule servers generate default events for the flows and message processors handling your business transactions, tracking such information as processing time and errors. In addition, you may have set up custom events to capture specific payload information. All events, whether custom or default, are stored for later retrieval and analysis. Using the Business Events tab, you can have the console retrieve transaction and event information, and you can audit events. Auditing events has only a low overhead on server performance.
This page explains how to use the transaction and event querying and filtering features.
Querying and Filtering Business Transactions and Events
You set up transaction queries from the main Business Events screen, the screen that opens when you click the Business Events tab. If you want to track default events, be sure first to enable default event generation and tracking for your application(s), as described in Business Events.
To query transactions and events:
-
Select a key from the Search pull-down list for limiting the selection. For example, you might specify
customIdorevent: typeas the key. -
Select an operator (that is, the condition for selecting values that match the key) from the pull-down list. You can choose operators such as equals, like, greater than, and less than. The operators available in the pull-down list vary depending on the key you select. For example, if you select
event:timestampas the key, you can choose from a list of arithmetic operators: Equals, Greater than, Greater than or equals, Less Than, or Less than or equals. If you select an event attribute as the key, such asevent: exceptionDetails, you can choose either the operators Equals, Starts with Contains, Ends with, Is empty, or Is not empty. -
Enter a value for the key. The search selects the events or transactions whose key field matches this value according to the selected operator.
Note, too, that you can specify the number of matching transactions you want retrieved. The default value is 50 transactions (highlighted in the figure below). Enter a new number to change this default.
The figure below shows how you might specify a simple search for transactions based on one key.
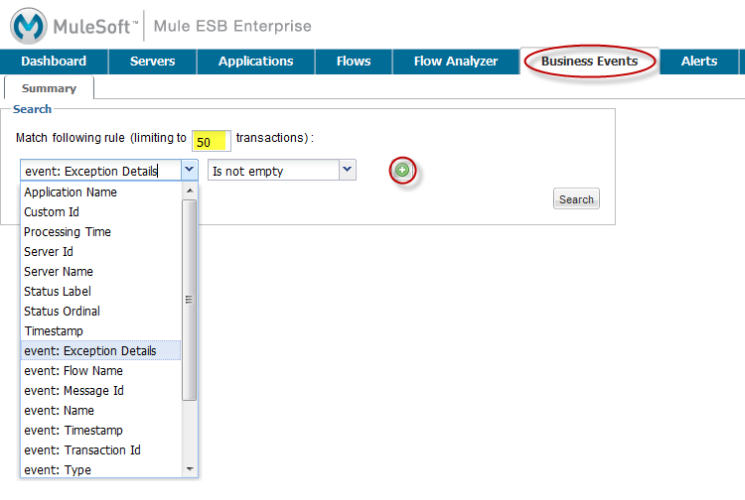
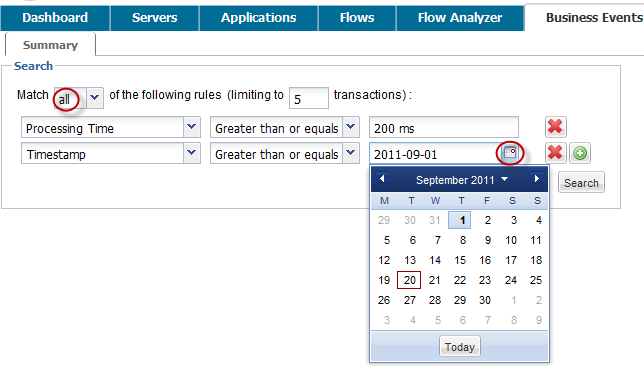
You can also set up more sophisticated queries by entering multiple key fields. Click the green plus sign icon (circled in the figure above) to the right of the key field selection to enter additional keys.
Select the keys and operators and enter values for any additional selection criteria in the same manner as for a single search criterion. Click the red X icon to the right of a criterion to remove it from the list. Click the green plus sign icon to add more selection keys.
When you use multiple selection criteria, you can further designate that the search must match all specified rules (this is the default condition) or that the the search can match any of the specified rules. Use the pull-down list above the selection rules to make this choice.
In addition to only letting you select appropriate operators for the key selection fields, the console also helps you enter the correct values. In the figure below, if a key field requires a date value, click the calendar icon in the value box to open a calendar from which you can select a date. The console then enters the date value in the correct format. The transactions from today, the current day, are displayed by default.
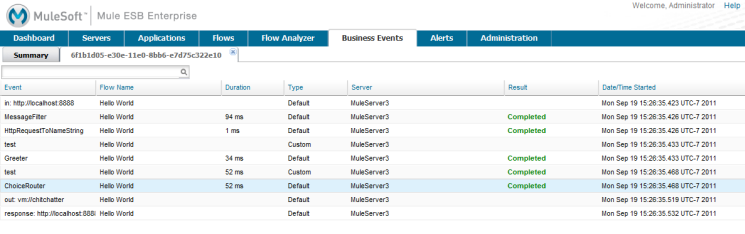
After specifying all the search rules, click the Search button to initiate the search and data retrieval. The lower portion of the screen displays a table with the transactions or events that matched the specified criteria. For example, the figure below shows the results of a search.
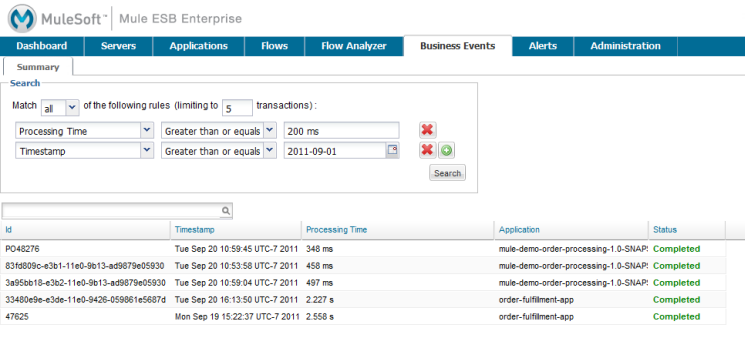
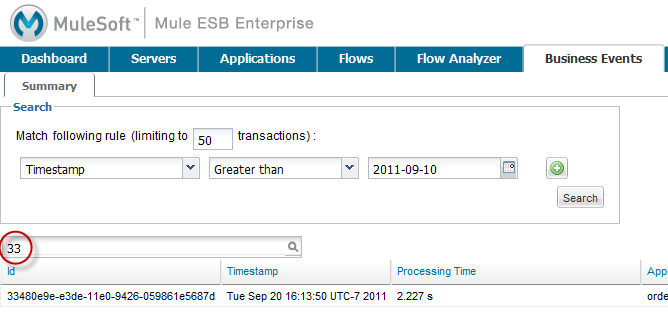
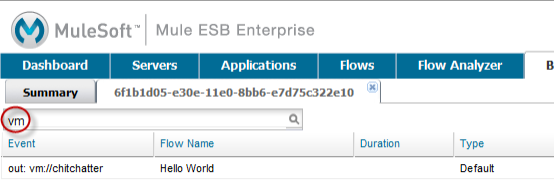
You can use the filter box to filter the displayed data. Filtering can be done on the event or transaction id, server, and status fields.
Keep in mind that these searchable fields are pre-populated and always available. This feature keeps the processing overhead to a minimum.
| Note that you can customize the transaction Id in your Mule application to make it more meaningful. See Business Events for more details. |
Viewing All Events for a Transaction
You can view details of all events for a single transaction.
After selecting a set of transactions, click the transaction id from the transaction display pane. The detailed events pane opens and shows all events within that transaction in a single list.
Using the console filter box, you can filter events by particular attribute values. Because the console does not need to communicate to the server to display a filtered list of event details, there is no impact on server performance.
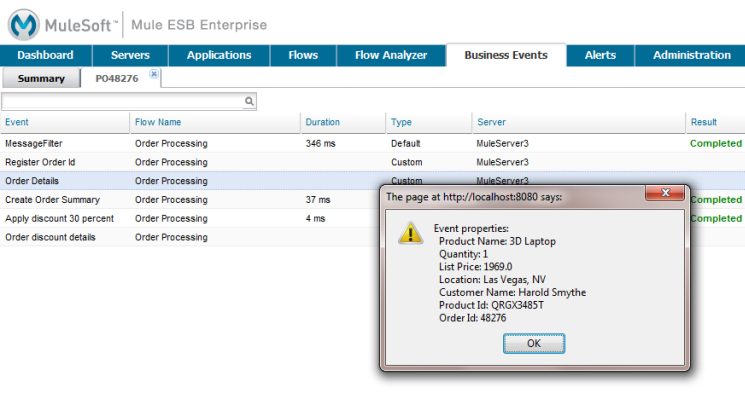
Click on an event to display properties defined for the event.
For example, suppose an application enables and defines a custom event as follows:
<tracking:custom-event-template name="orderDetails">
        <tracking:meta-data key="Order Id" value="#[ognl:orderId]" />
        <tracking:meta-data key="Customer Name" value="#[ognl:customer.firstName]
         #[ognl:customer.lastName]" />
        <tracking:meta-data key="Location" value="#[ognl:customer.city], #[ognl:customer.state]" />
        <tracking:meta-data key="Product Name" value="#[ognl:items[0].name]" />
        <tracking:meta-data key="Product Id" value="#[ognl:items[0].productId]" />
        <tracking:meta-data key="Quantity" value="#[ognl:items[0].quantity]" />
        <tracking:meta-data key="List Price" value="#[ognl:items[0].listPrice]" />
    </tracking:custom-event-template>

   <flow name="order_management" doc:name="Order Processing" tracking:enable-default-events="true">

   <cxf:jaxws-service serviceClass="com.mulesoft.demo.orderprocessing.ProcessOrderImpl"
    doc:name="Process SOAP Order request"/>

   <processor-chain>
       <tracking:custom-event event-name="Order Details" inherits="orderDetails"/>
        ...
       </processor-chain>
   </flow>
Clicking on the event named "Order Details" displays the properties defined for the event, as shown below.
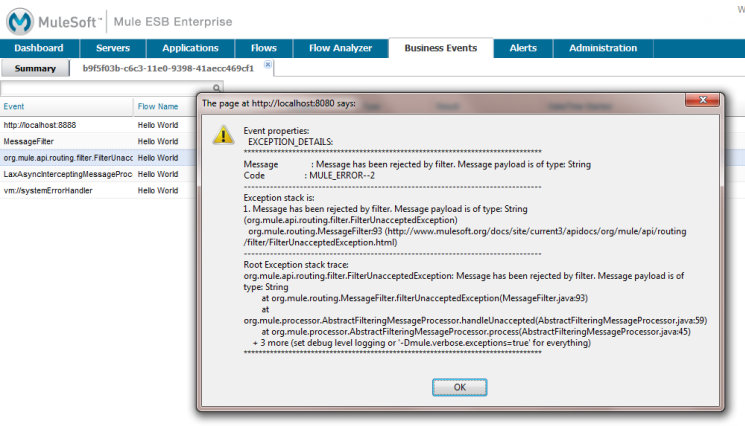
Or if default tracking is enabled, you can click on an exception event to get details.
Best Practices
There are a number of recommended practices related to runtime management of business events. These include:
-
Correctly size the database that will be used to store events. Mule stores event-related data in a default database, which persists the data. However, you also have the option to persist the data in an Oracle database. This can give you control over how much data to store. It can also provide better scalability and performance than the default data storage.
-
Fine-tune the cleanup script. The management console provides a cleanup script as part of the Admin Shell in the Administration tab. The script periodically cleans old data from the tracking database. By default, the script runs once a day and cleans all data from the database that is older than one week. You can customize the cleanup script so that it specifically meets your requirements.