Using the Management Console for Performance Tuning
Performance issues can occur for any particular flow. Developers need to both find the cause of performance bottlenecks and to work out satisfactory solutions. This use case scenario shows how to use the Mule Management console to detect flow bottlenecks and tune the performance of a running Mule instance.
If you notice a performance degradation in a flow, you can use the console to detect and pinpoint the bottleneck. For example, your application may start out running fast, but over time, particularly as its load increases, application throughput degrades. You can use the console tool to pin-point the cause of the bottleneck and to change the flow’s configuration to increase its performance.
Often, multiple factors lead to performance bottlenecks. You can use the console to work through all possibilities in an iterative fashion. Using the console features, you can make resource allocation changes at runtime, see how they affect flow performance, and do so without stopping and restarting the Mule ESB instance.
The Management Console allows developers to monitor resource utilization in real time and to make changes to the runtime parameters (the resource allocation configuration file) of the running Mule ESB instance. You can do all this from the same web console without restarting the Mule ESB server, dramatically reducing time and complexity for performance tuning of a Mule instance. This is a significant improvement over past approaches for monitoring resource usage, which required using profilers and other external tools. When using external tools, the Mule ESB instance had to be stopped, configuration XML files manually changed, then Mule had to be restarted and the testing cycle repeated.
While a flow is running, you can use the console panes (such as Pools and Memory) and their respective graphs and tables to see how resources are allocated and consumed, enabling you to quickly identify a bottleneck. When you find problems, you can use the console to change the flow’s resource allocations, such as the size of the pools. The flow does not have to be stopped and restarted, and the console runtime data lets you immediately see the effect of your changes. You can make as many passes as necessary and tweak different resource allocation parameters until you eventually remove the bottleneck and achieve the desired level of performance.
Use Case Background
In this scenario, a performance issue develops in a deployed and running flow. Using the console, the developer traces down the cause of the performance bottleneck. After identifying the likely cause, the developer dynamically changes the resource allocation configuration at runtime to improve the performance of the flow.
Our developer, Dan, works on a message enrichment and document aggregation application that uses the Mule ESB server. The application processes health care-related patient information.
Dan has successfully created a Mule configuration for the application using Mule IDE to handle this use case. He has deployed the application to the server and is now in the process of testing the flow. During this initial testing, Dan realizes that there are some performance issues with the flow. He knows he needs to tweak the Mule configuration file to achieve the desired performance level.
In brief, Dan follows these steps to resolve the problem:
-
He logs in to the Mule Management console.
-
He clicks the Pools tab for the server on which the application is running, then scans the pool usage to identify the bottleneck.
-
He can see that the pool sizes need to be changed, and he makes these changes from within the console.
-
He checks the pools utilization again, then monitors other metrics, such as memory and CPU usage, to ensure everything is properly configured.
-
He repeats the previous three steps until the desired level of performance is reached.
Detailed Performance Tuning Scenario
|
The figures that appear below do not necessarily reflect the actual data for the debugging process. They are meant merely to illustrate the console functions. |
When Dan starts testing the flow, he immediately sees some performance problems. Although the application performance is fine when first started, as the application load increases the processing throughput rate drops significantly.
For this flow, the client input is on the order of thousands of messages, even reaching a magnitude of 100,000. The initial response time of the message queue, 600 messages per second, provides good performance. However, over time the message queue bogs down handling its message load. As a result, the response time drops dramatically, eventually reaching a low of one to two messages per second.
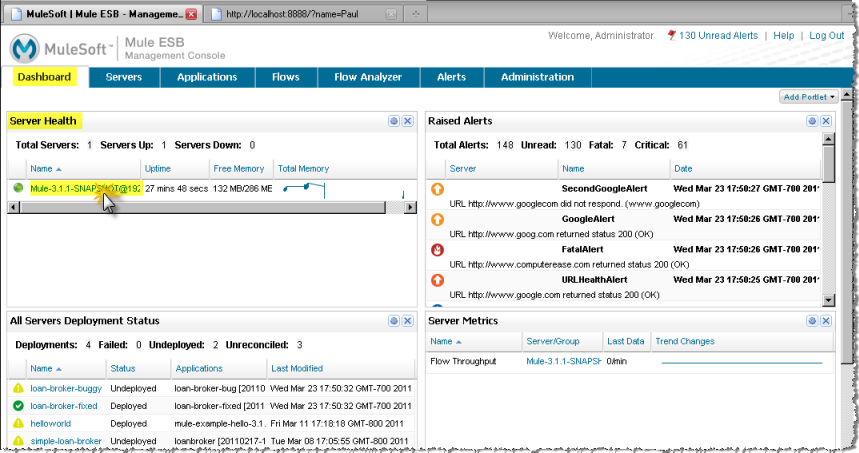
Dan needs to verify what’s happening and then fix the problem. To do so, he logs into the Management Console. The server is already registered and the flow is running. Dan takes a quick look at the Dashboard, then clicks the link to the server on which his application is running. He does so by clicking the server name from the Server Health portlet on the Dashboard (shown below).
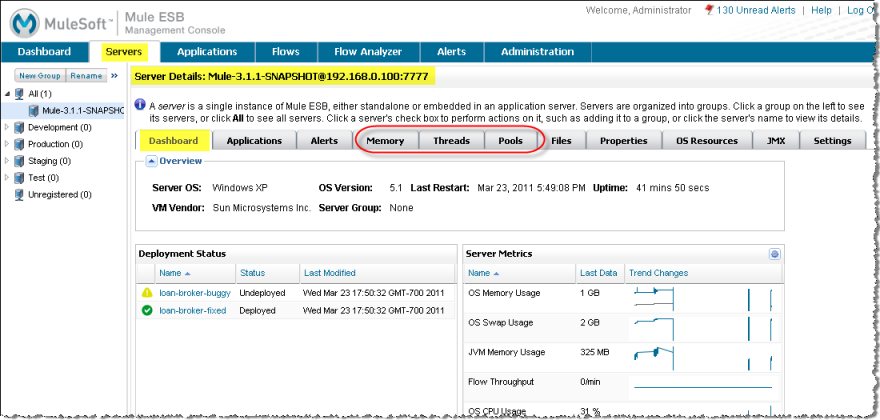
Clicking the server name opens the server-specific Dashboard pane displaying the Server Details summary. From this Dashboard, Dan can see overview data about the server and there is a set of tabs to access more detailed information about different functionality. See the figure below. Dan principally uses three tabs (Memory, Threads, and Pools) to display different information and to do most of the debugging work.
Debugging Process Details
Here’s how Dan’s debugging process might proceed.
-
First step: Eliminate obvious issues.
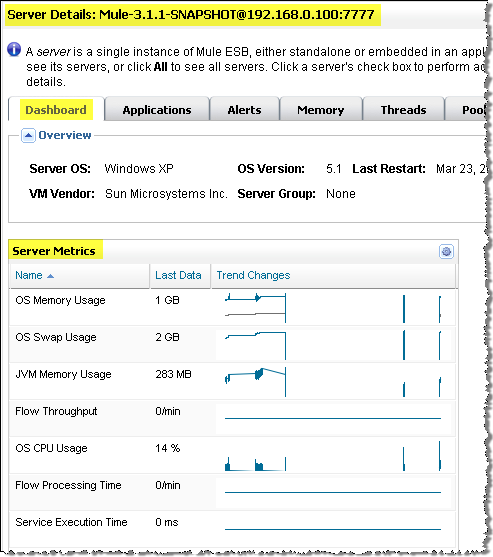
Dan first eliminates obvious performance bottlenecks, such as memory leaks. He starts by checking memory usage. The server Dashboard pane shows a summary of the server metrics, including memory usage. He scans the memory graphs to spot a trend: a memory graph that shows a constant growth could potentially denote a possible memory leak. Instead, he sees that there was a growth spike but then the memory heaps remained constant for some time. Based on this, Dan is not worried about a memory leak.
He clicks the OS Resources tab to get more information about memory usage. Scanning the page and its charts he checks if heap memory usage is at the upper limit, which would be a good indication of why performance is failing.
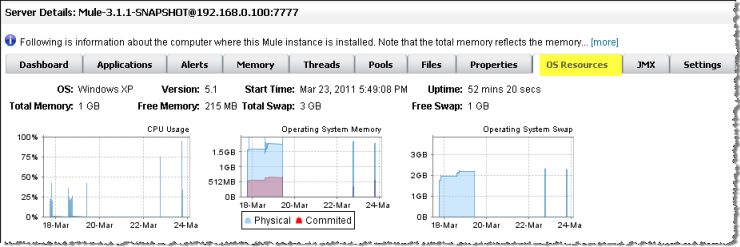
When heap usage is at the maximum, the JVM starts a garbage collection (GC) process that takes most resources for itself and causes other threads to freeze. When he sees heap usage at the upper limit, he is not surprised that response time is so bad.
-
Next, find the root cause of the heap usage.
Dan wants to see how the server is handling all running applications. He clicks the Flows tab and the console displays all flows and flows on the Mule ESB instance. He filters the display by state so that only currently running flows appear.
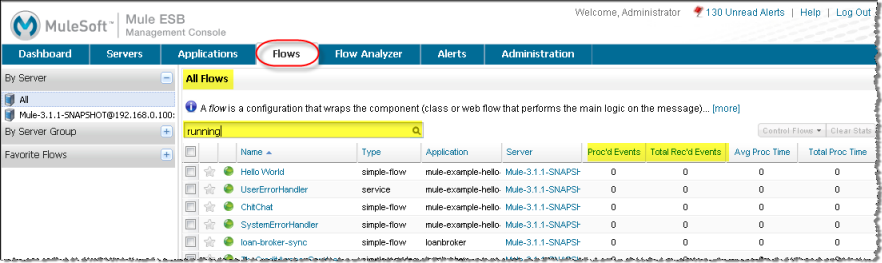
Examining the pane, he notices that the ratio of processed to received events indicates a high number of queued events for several flows. In fact, he deduces that 70% of the messages for these flows are queued up; that is, waiting for processing. The developer knows that while queued, messages take up memory on the JVM. Thus, the number of queued messages may be the cause of the high memory usage and explain why heap use is so high.
-
Find out why so many messages are queued up.
Dan now wants to determine why so many messages are on the queue. The Pools pane may have the answer, so he clicks the console Servers tab, then the Pools tab.
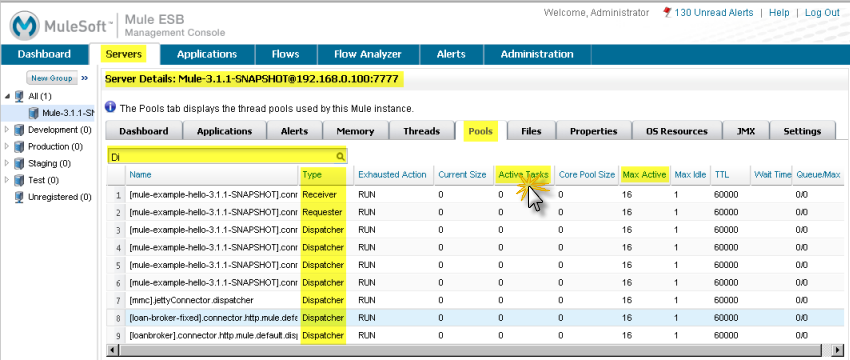
Here, he uses the filter to search the list of threads for Dispatcher threads, in particular the Dispatcher thread responsible for dispatching messages. He wants to see how the number of active tasks for this thread compares to the maximum number of active tasks. To make it easier to identify the pools using most of the threads, he clicks the Active Tasks column heading so that the display appears sorted by the value in this column.
He notices that a pool for an internal VM transport is using 16 active threads out of 16 Max Active threads, indicating that the threads are exhausted. Clearly, this is the bottleneck. At the same time, Dan notices that other types of threads, including the pool for the flow handling the use case, do not have many working active threads. Given this information, he suspects the entire process is synchronous. He needs to test the JMS endpoints, the file endpoints, and VM endpoints to see if this is the case.
-
Check the application configuration file to see how the endpoints are set.
The application configuration file that starts the application on the Mule ESB server defines the parameters for the endpoints. One such parameter indicates whether the endpoints are set to synchronous or asynchronous (asynchronous is the default setting).
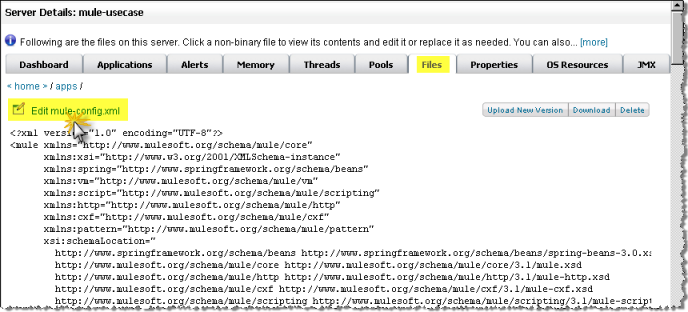
Dan clicks the Files tab, then navigates to the use case application folder within the /apps directory, then clicks the application configuration file to open it. Examining the file, he discovers the endpoints are set to synchronous. He clicks the Edit button (shown in the figure below) to change the endpoint configurations to asynchronous.
He saves the configuration file and re-runs the application, immediately seeing a big improvement in performance. However, performance could still be better.
-
Use the Management Console panes to continue iterative search for the root cause of the bottleneck.
Dan opens the console Flows pane, and again sees that messages are queued up. While the numbers are better, they are still not optimal. He clicks the Pools tab again and sees that the suspicious Dispatcher thread is again exhausted, along with several other flows.
-
Increase the number of Max Active threads for the dispatcher thread.
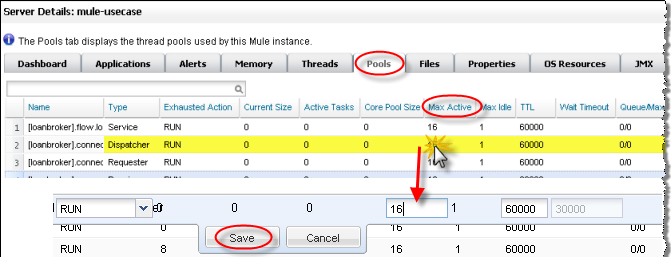
Working directly through the console, Dan increases the number of Max Active threads to 50 for the dispatcher thread. He clicks the current Max Active value for the dispatcher thread. The console redisplays the selected thread in an editable mode, and Dan changes the 16 to 50. He clicks Save to ensure the new value is stored.
-
Balance the event processing load across all flows.
To get even better performance, Dan wants to balance the event processing load across the server. He clicks the Flows tab to check the events processing numbers. Through the Flows tab, he can see a flow’s process events, total received events, plus average and total event processing time.
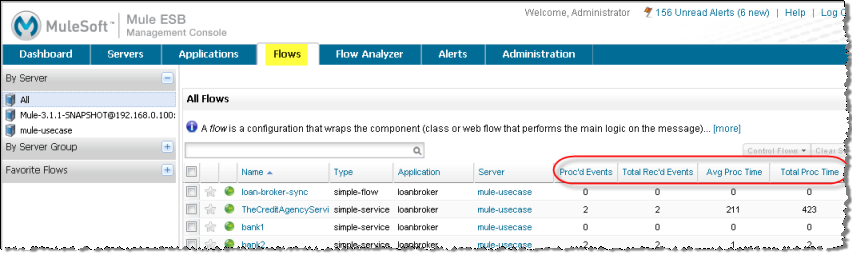
Depending on what he sees, he may want to increase the Max Active threads for those flows processing less events, since they likely have more messages waiting in their respective queues, and possibly decrease the Max Active value for those flows processing a great number of events. He also clicks the Threads tab and looks at the WC (Wait Count) and BC (Blocked Count) values to estimate the rate of event processing.
After some additional data analysis, he again checks the OS Resources tab and notices the CPU was been highly utilized (between 95% and 100%) regardless of the flow performance. He concludes that the transport is not doing its work because most internal VM transport threads are waiting for CPU time while doing a context switch. To alleviate this problem, Dan reduces the VM pool size (the Max Active threads for the VM transport) and immediately notices both an increase in the pool’s Active Tasks as well as improved application performance. With some trial and error, Dan finds the right values and load balance for the pools configuration for the specific hardware running the Mule server.
-
Check memory usage again.
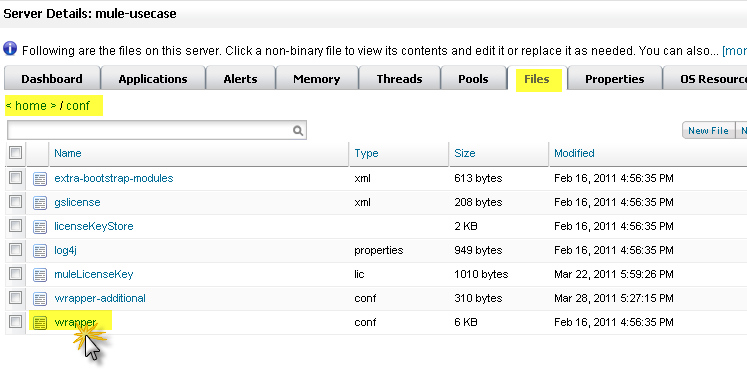
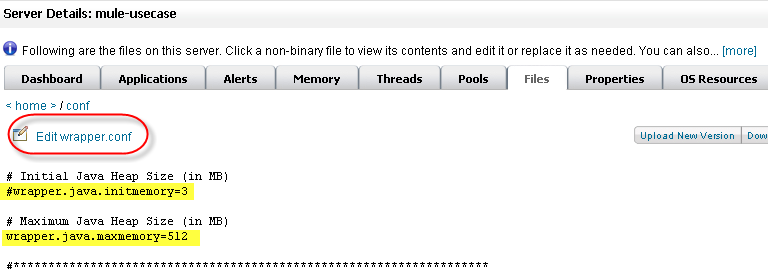
Dan returns to the Memory pane and sees that Heap memory is again running out. He knows he has to change some additional memory-specific configuration values. Dan clicks the Files tab, navigates to the /conf directory, and opens the wrapper.conf file.
He checks the initial and maximum heap values set in the file, and sees that the initial heap size is set to three megabytes and the maximum heap size is set to 512 megabytes. He clicks the edit button, increases both the initial maximum heap sizes to one gigabyte, then saves the wrapper.config file.
-
Run the load test again.
Dan runs the test again. Not only does he see good performance at the start, the performance stays at 600 messages per second. Dan has used the Management Console to view system aspects that affect performance and has changed these values to achieve optimal performance throughput.
Lessons Learned
The Mule Management Console lets Dan to work in real time: he is able to monitor resource utilization and dynamically change the running Mule instance’s parameters. He can do all this from the same web console without restarting the Mule server. As a result, the time and complexity to tune the performance of Mule instances is significantly reduced.
If Dan did not have the console feature available, performance tuning would have been much more time consuming and difficult. Changes to Mule instance parameters would have required multiple iterations of stopping the server, manually making the changes in the configuration file, then restarting the server.
In addition, Dan would have needed the experience to use a Java profiler, a sophisticated tool, and would have had to run the Mule server in debug mode. Even so, this may not have helped, since a profiler shows only low-level data about Java objects, threads utilization, and performance. To make use of this low-level data, Data would need knowledge of the internal Mule architecture.
Dan found that using the Management Console not only reduced complexity, but it also resulted in a faster time to solution. The debugging process was faster because he did not have to stop and restart the Mule instance. He was able to make all necessary changes, whether to parameters or configuration files, right from the console.
Dan was able to work with high-level data and metrics that are specific to the Mule ESB server. He only needed knowledge of the flow structure rather than the details of the Mule architecture and expertise with a profiler.