Working with Flows
A flow is a configuration that wraps the component (class or web service that performs the main business logic on the message) as well as the relevant routers, filters, and transformers. You use the Flows tab to start, stop, or pause a flow and to audit the flow.
Select All (for all servers) in the navigation tree on the left to see the flows for all servers.
Select All to also see the flows in all clusters.
Alternatively, to display just the flows from a particular server, navigate to that server using the tree on the left and click the server name.
To display just the flows from a particular cluster, navigate to that cluster using the tree on the left and click the cluster name.
To find a particular flow or flows, start typing the name of the flow in the search box—the table in the pane immediately displays all flows that match the search string.
Listing Flows
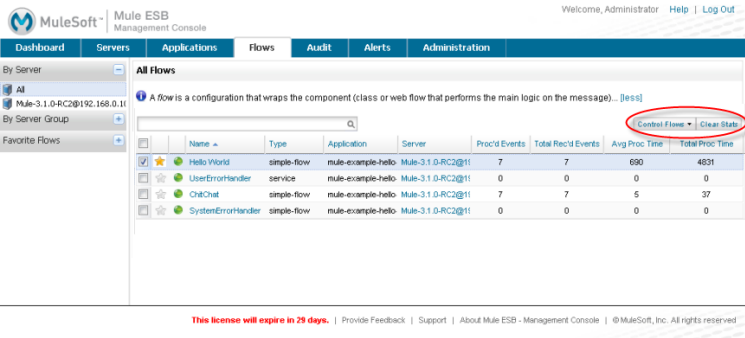
When you first open the Flows tab, a table lists all flows for the selected server or all servers. For example, the figure below shows the flows for all servers. It also highlights the buttons for stopping and starting flows and clearing statistics.
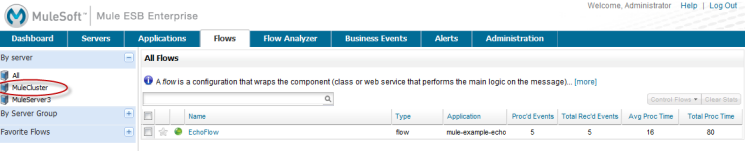
The table also lists all flows for the selected cluster or all clusters.
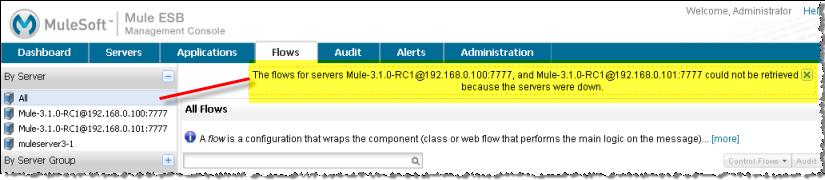
If some servers you are monitoring are down and you select a group of servers, such as All, that includes these non-running servers, you may see an informational error message such as the one highlighted in the figure below.
The Flows table includes the following information:
-
Star icon: When colored orange, the star icon indicates that this is a favorite flow. Favorite flows appear within the Favorite Flows grouping on the left. Click the star icon to turn it orange or to turn it back to grayed out.
-
Circle icon: When green, indicates the flow is running. When red, indicates the flow is stopped.
-
Name: The name of the flow.
-
Type: The type of the flow; for example, a simple flow.
-
Application: The name of the application using the flow.
-
Server: The server hosting the flow
-
Proc’d Events: The number of messages processed by the flow.
-
Total Rec’d Events: The total number of messages received by the flow.
-
Avg Proc Time: The average amount of time in seconds that the flow takes to process a message.
-
Total Proc Time: The total amount of time in seconds that the flow takes to process all messages.
To take action on a flow, select its check box and then click the appropriate button on the right above the table columns. The buttons let you control the flow (start, stop, or pause the flow) and clear the statistics on the flow. If you click the Clear Stats button, a dialog appears asking you to confirm that you want to clear the statistics for the selected flow. You can proceed or cancel the operation.
To view details about a flow, click its name. There are several panes for viewing details about a particular flow accessible via the Summary and Endpoints tabs. These panes are discussed in the next sections.
Viewing More Information About a Flow
To view more information about a flow, click the flow name in the table. A Flow Details pane opens and displays a Summary tab with more specific information about the selected flow. A Summary tab display appears for all flows, regardless of the type of the flow. While all Flows regardless of type have an Endpoints tab, the endpoints display may be empty if no endpoints exist. In addition, the Summary tab displays different data and sets of charts depending on the flow type.
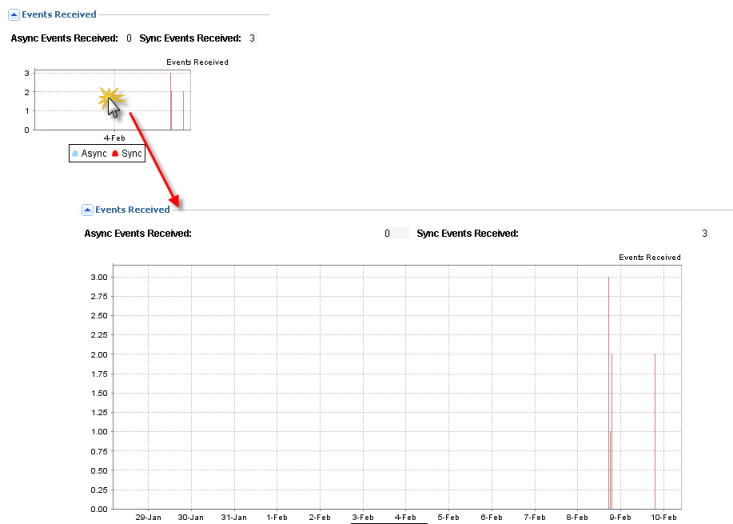
Note that you can expand any of the charts on the Flow Details panes. Click the chart itself and it expands. Click the expanded chart to reduce it back to the thumb-nail size. For example, the figure below shows how clicking in the Events Received thumb-nail chart expands it to its full size:
Simple Flow Summary Information
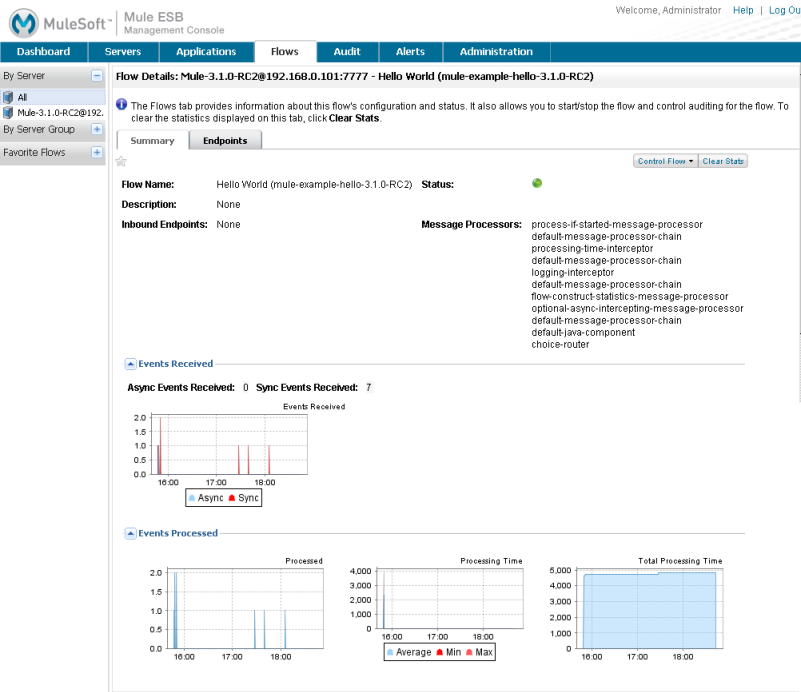
The Summary tab for a simple flow displays key information about the flow, including descriptive information such as the flow name, status, description, message source, and message processors. (See the figure below.) The pane also includes appropriate charts that provide diagnostic data, such as data about synchronous and asynchronous events received and also time indicators for events the flow processed.
Use the Control Flow buttons to start, stop, or pause the flow, and the Clear Stats button to clear the flow statistics.
Flow Diagnostic Charts
The diagnostic tables and their related charts provide information about executed events and errors, and information about queues and their execution time and errors. You can click a chart to zoom in and out on it. The tables contain the following information:
Events and Errors Information
Executed Events: The number of executed events.
Executed Errors: The number of executed errors.
Fatal Errors: The number of fatal errors.
Async Events Sent: The number of asynchronous events that were sent.
Async Events Received: The number of asynchronous events that were received.
Sync Events Sent: The number of synchronous events that were sent.
Sync Events Received: The number of synchronous events that were received.
Total Events Received: The total of all events received.
Total Events Sent: The total of all events sent
Queues and Errors Information
Queued Events: The number of current queued events.
Max Queue Size: The maximum number of events that can be in the queue.
Avg Queue Size: The average number of events in the queue.
Min Execution Time: The minimum time to execute an event
Max Execution Time: The maximum time to execute an event
Total Execution Time: The total time to execute the events in the queue.
Managing Endpoints
Use the Endpoints tab to see detailed information about a flow’s inbound and outbound endpoints. You can also control endpoints (that is, start or stop a flow’s endpoints) from the Endpoints pane.
You might want to control an endpoint when developing and debugging an application, or when deploying an application. See Use Case Scenarios for Controlling Endpoints.
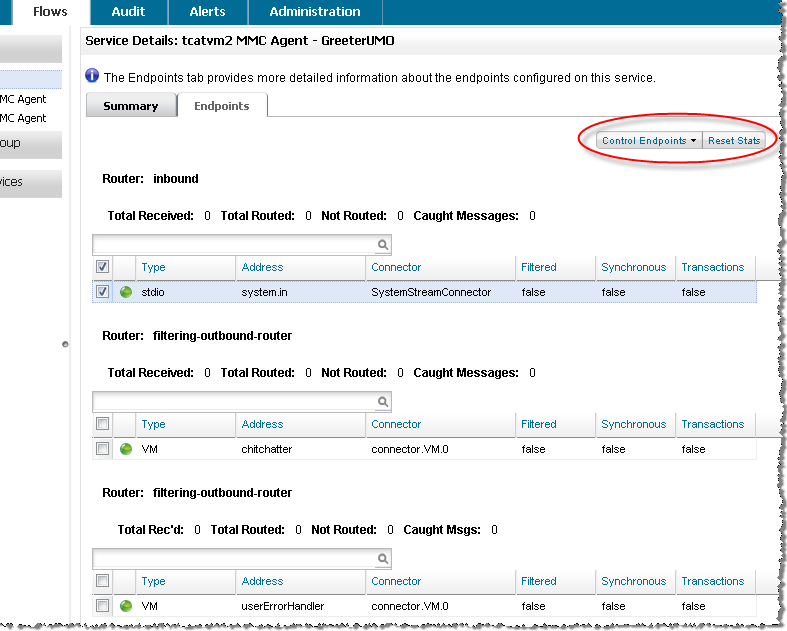
Click the endpoint(s) you want to control, then select Start Endpoints or Stop Endpoints from the Control Endpoints pull-down list. Endpoints that are currently running are marked with a green circle. Endpoints that are currently not running are marked with a red circle.
Notice that each endpoint, inbound and outbound, has its own table. Identifying and summary information appears first, above the table, followed by the endpoint details in the table itself. The identifying and summary information includes the following:
-
Router: The name of the router, such as filtering-outbound-router, appears first.
-
Total Received: Indicates the total number of messages received by the endpoint router.
-
Total Routed: The total number of routed messages handled by the router.
-
Not Routed: The total number of messages that were received but not routed.
-
Caught Messages: The total number of messages that were caught by the endpoint router.
The table beneath these router totals shows the details for each endpoint using that router. Use the search box to limit the endpoints display to only endpoints whose name matches, or partially matches, the string you enter.
For each endpoint, the details table displays the following:
-
Type, such as stdio or VM (virtual machine).
-
Address, such as
system.out. -
Connector name, such as
SystemStreamConnector. -
Filtered, a boolean value indicating whether the endpoint is filtered or not.
-
Synchronous, a boolean value indicating whether the endpoint is synchronous or asynchronous.
-
Transactions, a boolean value indicating whether the endpoint handles transactions.
Use Case Scenarios for Controlling Endpoints
There are several scenarios when you might want to stop and start an application’s endpoints. This is a particularly useful feature when flows have more than one endpoint.
During development, it may be helpful to stop an endpoint so that you can focus on a particular part of your application. For example, you might want to stop an endpoint so that you can eliminate a potential source of errors. You might do this if you are tracing down an application performance problem. You have determined that something with application messages is slowing down your system, but you need to isolate the source of the message that is causing the bottleneck. In a scenario such as this, you would frequently stop some endpoint, check the performance, then start that endpoint. You would repeat these steps with different endpoints until discovering the problem.
When deploying an application, some circumstances might compel you to verify that your application is not receiving some events while it is still processing certain other events. To make sure that processing is occurring without interference from other messages being received, you might stop corresponding endpoints. After verifying that everything is normal, you would then restart the stopped endpoints. For example, you might have an online shopping website and you want it to focus on web sales over everything else during the holiday season. At these high-volume sales times, you might want to shut down some partner or non-direct requests, and you would so so by stopping certain endpoints.
You might also use this feature when testing a flow that uses multiple endpoints to manage different protocols and requirements. You might want to stop the HTTP external endpoint while you are conducting some tests so that the flow is not exposed to the outside world and thus not used. At the same time, you want to keep other internal endpoints running (these are endpoints within or behind your firewall, such as JMS endpoints) so that you can go forward with your tests.