-
Servers
-
Groups
Working With Alerts
Overview
Alerts give you visibility to events that might need your attention and allow you to notify other administrators about actions they need to take. An alert can consist of a description, the email address of the person(s) you need to notify, the priority of the action, and optionally an SNMP address and an action script to run.
A Service Level Agreement (SLA) is a key concept with alerts. The SLA defines the conditions on a target object about which you want visibility. In essence, the SLA defines the high and low thresholds of the values for the target conditions. An alert is raised when the values of the target object’s condition are outside of these SLA thresholds. An alert triggers a SLA policy event, and this event dynamically carries information to other parts of the system.
Furthermore, when an alert occurs, a pop-up appears briefly and indicates that the alert condition occurred.
In addition to alerts, you can also set watches on target objects and conditions. A watch is a way to schedule, hold, and group events and objects. A Threshold Manager keeps tabs on watches that have been set. It checks the values provided by the watch against an SLA. The manager triggers an event if the values go beyond the SLA threshold level or when the values return to normal levels.
How Alerts Work
You use the alerts functionality to keep on top of the health of all servers you are monitoring. Alerts give you visibility into many different aspects of the health and functioning of your servers. Generally, you set up alerts so that you are immediately notified of critical situations that require prompt intervention, such as when a server is down, or to give you a warning of potential troubles that may be developing, such as low memory, so that you can take proactive steps to handle the problem.
There are a number of different types of alerts that you can set up. You indicate the alert type when you add or create a new alert (covered in Defining SLAs and Alerts). In addition to the type, you also select the severity level of the alert and, for most alert types, you define parameters for raising that alert.
Select the alert type according to the problem for which you want visibility. The table below shows the different alert types.
| Alert Type | Description | Works in |
|---|---|---|
Custom Expression |
Raises an alert depending on the evaluation of a target object custom expression |
|
Exception |
Raises an alert when an exception of a specified type occurs for an application |
|
JMX Attribute |
Raises an alert based on the evaluation of a JMX attribute value in an MBean |
|
Low Memory |
Raises an alert when a specified memory pool reaches a specified memory threshold level |
|
Log Regex |
Raises an alert based on a specified regular expression in specified log files |
|
Server Down |
Raises an alert when a specified server or server group is down. Also raises an alert when a node in a cluster is down |
|
Server Up |
Raises an alert when a specified server or server group comes up. Also raises an alert when a node in a cluster comes up |
|
Thread Pool |
Raises an alert when a specified thread pool reaches a specified threshold ratio |
|
URL Health |
Raises an alert when a specified URL location returns a particular status code |
|
When an Alert is Raised
The parameters that you define for alert types determine when that alert is raised. The parameters are the conditions which, when met, will cause an alert to be raised. An alert is raised only when the conditions you define for a particular alert type are met.
Each alert type has a set of parameters that you define. Alert type parameters vary according to the type of the alert. Some parameters are common to all alerts. All alert types (except for URL Health) require that you specify the server or server group to which the alert should apply. In addition, you can mark an alert as active or not. (When you define a new alert type, by default it is active unless you explicitly uncheck the Active box.) The console raises an alert only for alert types marked as active.
For example, if you want an alert raised when available memory falls below a certain threshold point, you would set up a Low Memory alert type and then set the threshold parameter to the percentage at which you want notification.
Alert Severity Level
In addition to selecting alert types and specifying their parameters, you also apply a severity level to each alert. The severity level enables you to quickly find more critical situations from other, less problematic alerts that may be raised.
You decide which alerts are of utmost importance for you to spot immediately and which alerts, while important, can be addressed with less urgency. The console color-codes and marks fatal, critical, and major alerts so that they stand out from minor and informational alerts in the raised alerts display.
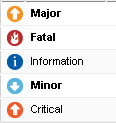
The figure below shows how the different alert type severity levels appear in the View Raised Alerts pane.

Viewing Raised Alerts
Click the Alerts tab to manage and view alerts. From this screen, you can use the nodes in the navigation tree on the left to view and manage raised alerts (that is, alerts that have been triggered), definitions for all alerts that have been set whether triggered or not, alert destinations, and alert notifications. When you first click the Alerts tab, the pane displays raised alerts.
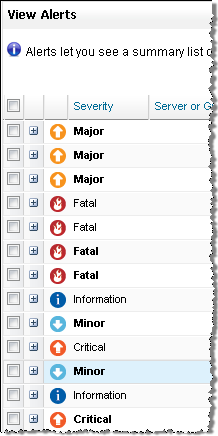
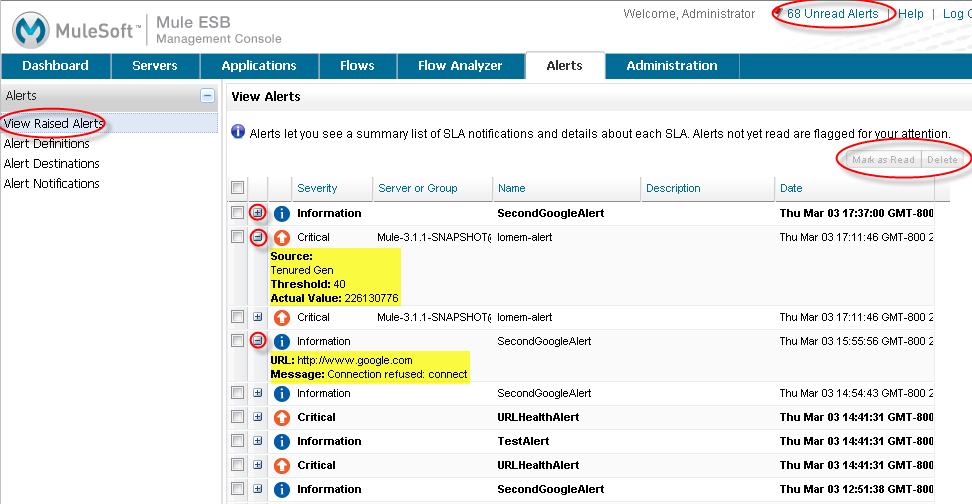
Click the View Raised Alerts node in the navigation tree on the left to view alerts that have been triggered. The details pane displays a table with summary information about each alert, plus icons that indicate the severity of the alert. Alerts that have not yet been read appear bolded, as shown in the figure below. In addition, the number of unread alerts appears highlighted in red at the top of the pane.

The View Raised Alerts pane shows the following information about each alert:
-
Severity of the alert. The severity of an alert is set when the alert is created, and can be one of the following: Fatal, Critical, Major, Minor, Information.
-
Server (or server group) on which the alert occurred
-
Name of the alert, per the alert definition
-
Description, per the alert definition.
-
Date, which is a time stamp indicating the date and time the alert was raised
Click anywhere on an alert row to select that alert and mark that alert as read. You can also check one or more alerts and click the Mark as Read button to mark these checked alerts as read, or click the Delete button to delete checked alerts. As noted, once an alert is read, its font changes from bold to plain.
The icons to the left of each alert indicate the severity of the alert, as shown in the figure below. Hover the mouse over these icons to see what they represent.

Briefly, the icons indicate the following:
-
The letter "i" on dark blue background: Information alert
-
Down arrow on light blue background: Minor alert
-
Up arrow on orange background: Critical alert
-
Up arrow on yellow background: Major alert
-
Fire icon on red background: Fatal alert
When a plus  sign appears to the left of an alert, it indicates there are more details about the triggered alert. Click this plus sign to see further details about the alert. In the above figure, you can see details about two of the alerts.
For alerts that have been triggered, the details portion displays information relevant to the type of the alert. For example, it might show data such as the following:
-
Source: The source of the alert, such as code cache or Tenured Gen. The source of the alert depends on the alert type.
-
Threshold: The value at which point the alert is triggered, if appropriate to the alert type.
-
Actual Value: The actual value that triggered the alert.
-
Times Triggered: The number of times the alert has been triggered.
-
URL address: For URL Health alerts
-
Message: The error message, if a URL Health alert
You may have these details displayed for multiple alerts simultaneously. Click the minus sign to close these additional details for an alert.
New Alerts Notification
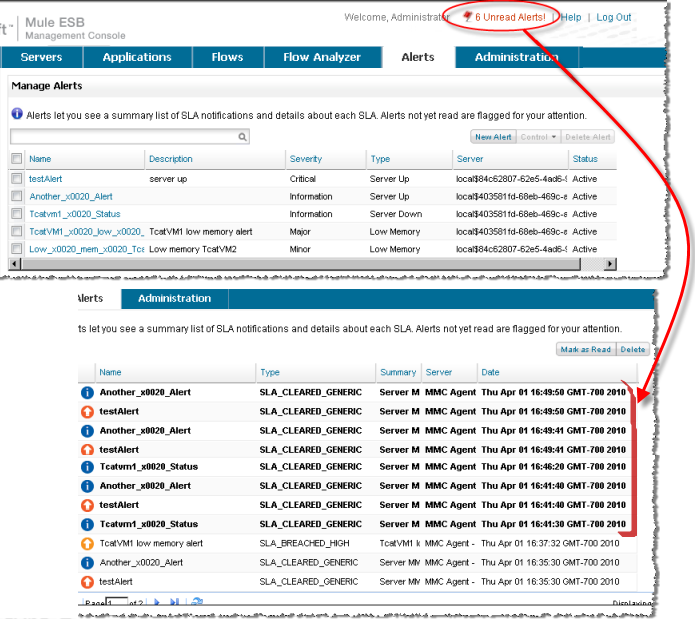
The Alerts screen displays a message in red at the top notifying you of the number of alerts that have not yet been read. This notification about unread alerts appears at the top of all console panes. In addition, when an alert is triggered, a pop-up appears briefly indicating the alert that was triggered. You see this pop-up regardless of the console pane you are currently viewing. The new alert also increments the unread alerts counter, assuming you haven’t yet looked at that alert. In addition to incrementing the counter, a note appears indicating the number of new alerts just added.
Click the notification of unread alerts, circled in red in the figure below, to open the pane to view alerts.

When the pane displaying raised alerts opens, notice that any unread alerts appear in bold font at the top of the pane. Alerts that have already been read are in plain font at the bottom of the pane, and the counter of unread alerts is decremented. The number of newly added alerts is also noted. Click an alert to read it.


