To Analyze Business and API Data using ELK
This topic describes how to use the Elastic Stack (ELK) to analyze the business data and API analytics generated by Anypoint Platform Private Cloud Edition. It also describes how to use Filebeat to process Anypoint Platform log files and insert them into an Elasticsearch database. After inserting the files into Elasticsearch, you can analyze them with Kibana.
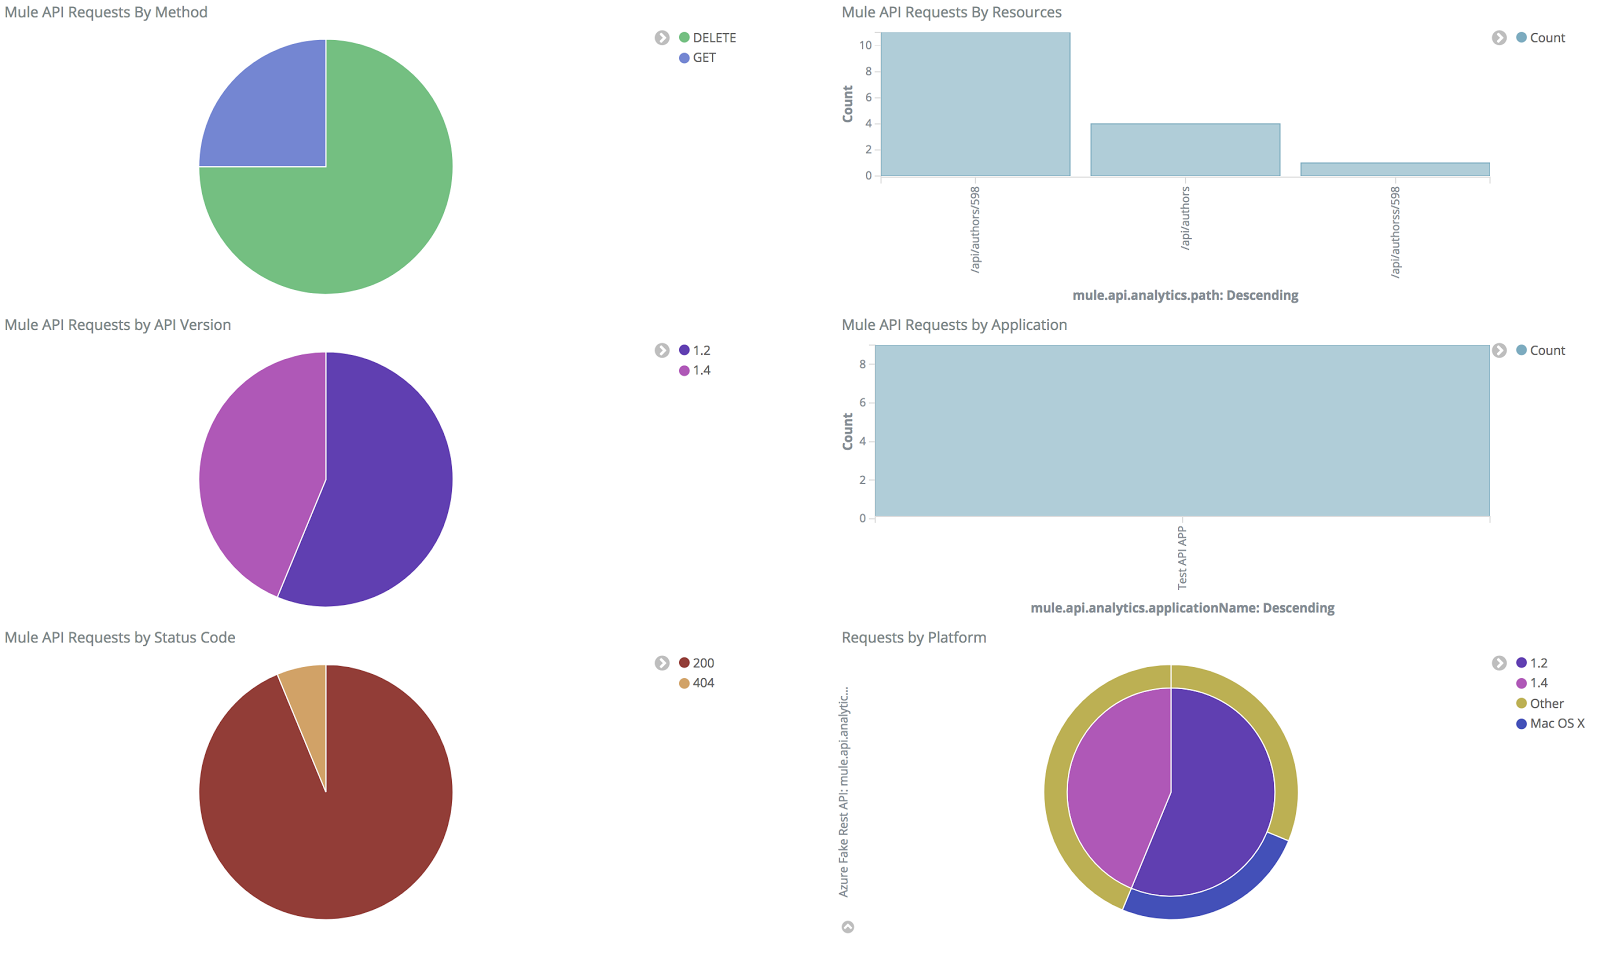
The following image shows an example of how API data appears in Kibana.

Requirements
To export external analytics data to ELK, you must have the following software:
-
Mule Runtime, version 3.8.4 or greater
-
Mule Runtime Manager Agent, version 1.7.0 or greater
-
Elasticsearch, version 5.6.2
-
Filebeat, version 5.6.2
-
Kibana, version 5.6.2
Prerequisites
-
Ensure that you have installed and configured your Mule runtime instances.
-
Ensure that you have registered these instances with Runtime Manager.
Edit the wrapper.conf Properties File
In your Mule runtime installation, edit the following the conf/wrapper.conf file.
-
Set the
analytics_enabledproperty totrue.wrapper.java.additional.<n>=-Danypoint.platform.analytics_enabled=true
-
Remove the URI value from the
analytics_base_uriproperty.wrapper.java.additional.<n>=-Danypoint.platform.analytics_base_uri=
-
Set the
on_premproperty totrue.wrapper.java.additional.<n>=-Danypoint.platform.on_prem=true
Enable Event Tracking
To export business and event tracking data, you must enable event tracking in runtime manager.
-
From Anypoint Platform, click Runtime Manager.
-
Click Servers.
-
Click the row containing the server where you want to configure ELK.
-
Click Manager Server, then click the Plugins tab.
-
Under Event Tracking, select Business Events from the Levels drop down.
-
Click the switch to Enable event tracking on ELK.
Runtime Manager displays the ELK Integration dialog.
-
Configure the log files as necessary.
-
Click Apply
Enable API Analytics
To export API analytics, you must enable API analytics in Runtime Manager.
-
From Anypoint Platform, click Runtime Manager.
-
Click Servers.
-
Click the row containing the server where you want to configure ELK.
-
Click the switch to enable API analytics, the click the switch next to ELK.
-
Configure the log files as necessary.
-
Click Apply
Install and Configure the Filebeat Agent
You must install the Filebeat agent on each server where you have Mule runtime instances.
-
Download and install Filebeat for your operating system.
Configure the Mule Filebeat Module
You must install the Filebeat module on each server where you have Mule runtime instances.
-
Download and expand the Filebeat Module archive from the following URL:
https://s3.us-east-2.amazonaws.com/elk-integration/elk-integration-09-29-17/elk-integration.tar.gz
-
Add the absolute paths of each log file to the
filebeat.ymlfile:-
Add the event log paths to the
var.pathsvariable ofbusiness_eventsas shown in the following example:business_events: enabled: true ... var.paths: - /var/mule/logs/instance1_events.log - /var/mule/logs/instance2_events.log ... -
Add the API analytics log paths to the
var.pathsvariable ofapi_analyticsas shown in the following example:api_analytics: enabled: true ... var.paths: - /var/mule/logs/instance1_api-analytics-elk.log - /var/mule/logs/instance2_api-analytics-elk.log
-
-
Add your Elasticsearch host to the
hostsproperty:output.elasticsearch: ... hosts: ["http://your_elastic_installation:9200"] ...
-
Update the Filebeat configuration
-
If you installed Filebeat using a Linux package manager, run the following script included in the Filebeat module download:
setup_mule_module.sh
-
If you installed Filebeat using another method, you must
-
copy
filebeat.template.mule.jsonandfilebeat.ymlto the root installation folder of Filebeat -
copy the
mulemodule folder to themodulefolder of your Filebeat installation.
-
-
-
Start Filebeat as a service on your system.
For example, if you are using an RPM package manager:
sudo /etc/init.d/filebeat start
-
Configure Filebeat to start automatically during boot:
sudo chkconfig --add filebeat
Install the Elasticsearch Geoip and Agent Modules
You must install the following Elasticsearch plugins:
-
Geoip: determines the geographical location of IP addresses stored in your logs.
-
User Agent: determines information about a browser or operating system based on HTTP requests.
Configure Kibana and Import the MuleSoft Kibana Dashboards
After installing Filebeat and Elasticsearch, you must configure Kibana to be able to consume data from Anypoint Platform.
MuleSoft provides a set of default Kibana configuration that you can use to analyze business and API data. These include dashboards, searches, and visualizations.
-
Configure an Index Pattern
You must create an Elasticsearch index for the Anypoint Platform data.
-
Generate initial set of data.
This is required for the index to be created so that Kibana can recognize this. For example, you can send a request to a test API to generate an initial set of data.
-
In the Kibana management console, create an index pattern with
mule-*as the value.
-
-
Obtain the Index Pattern ID
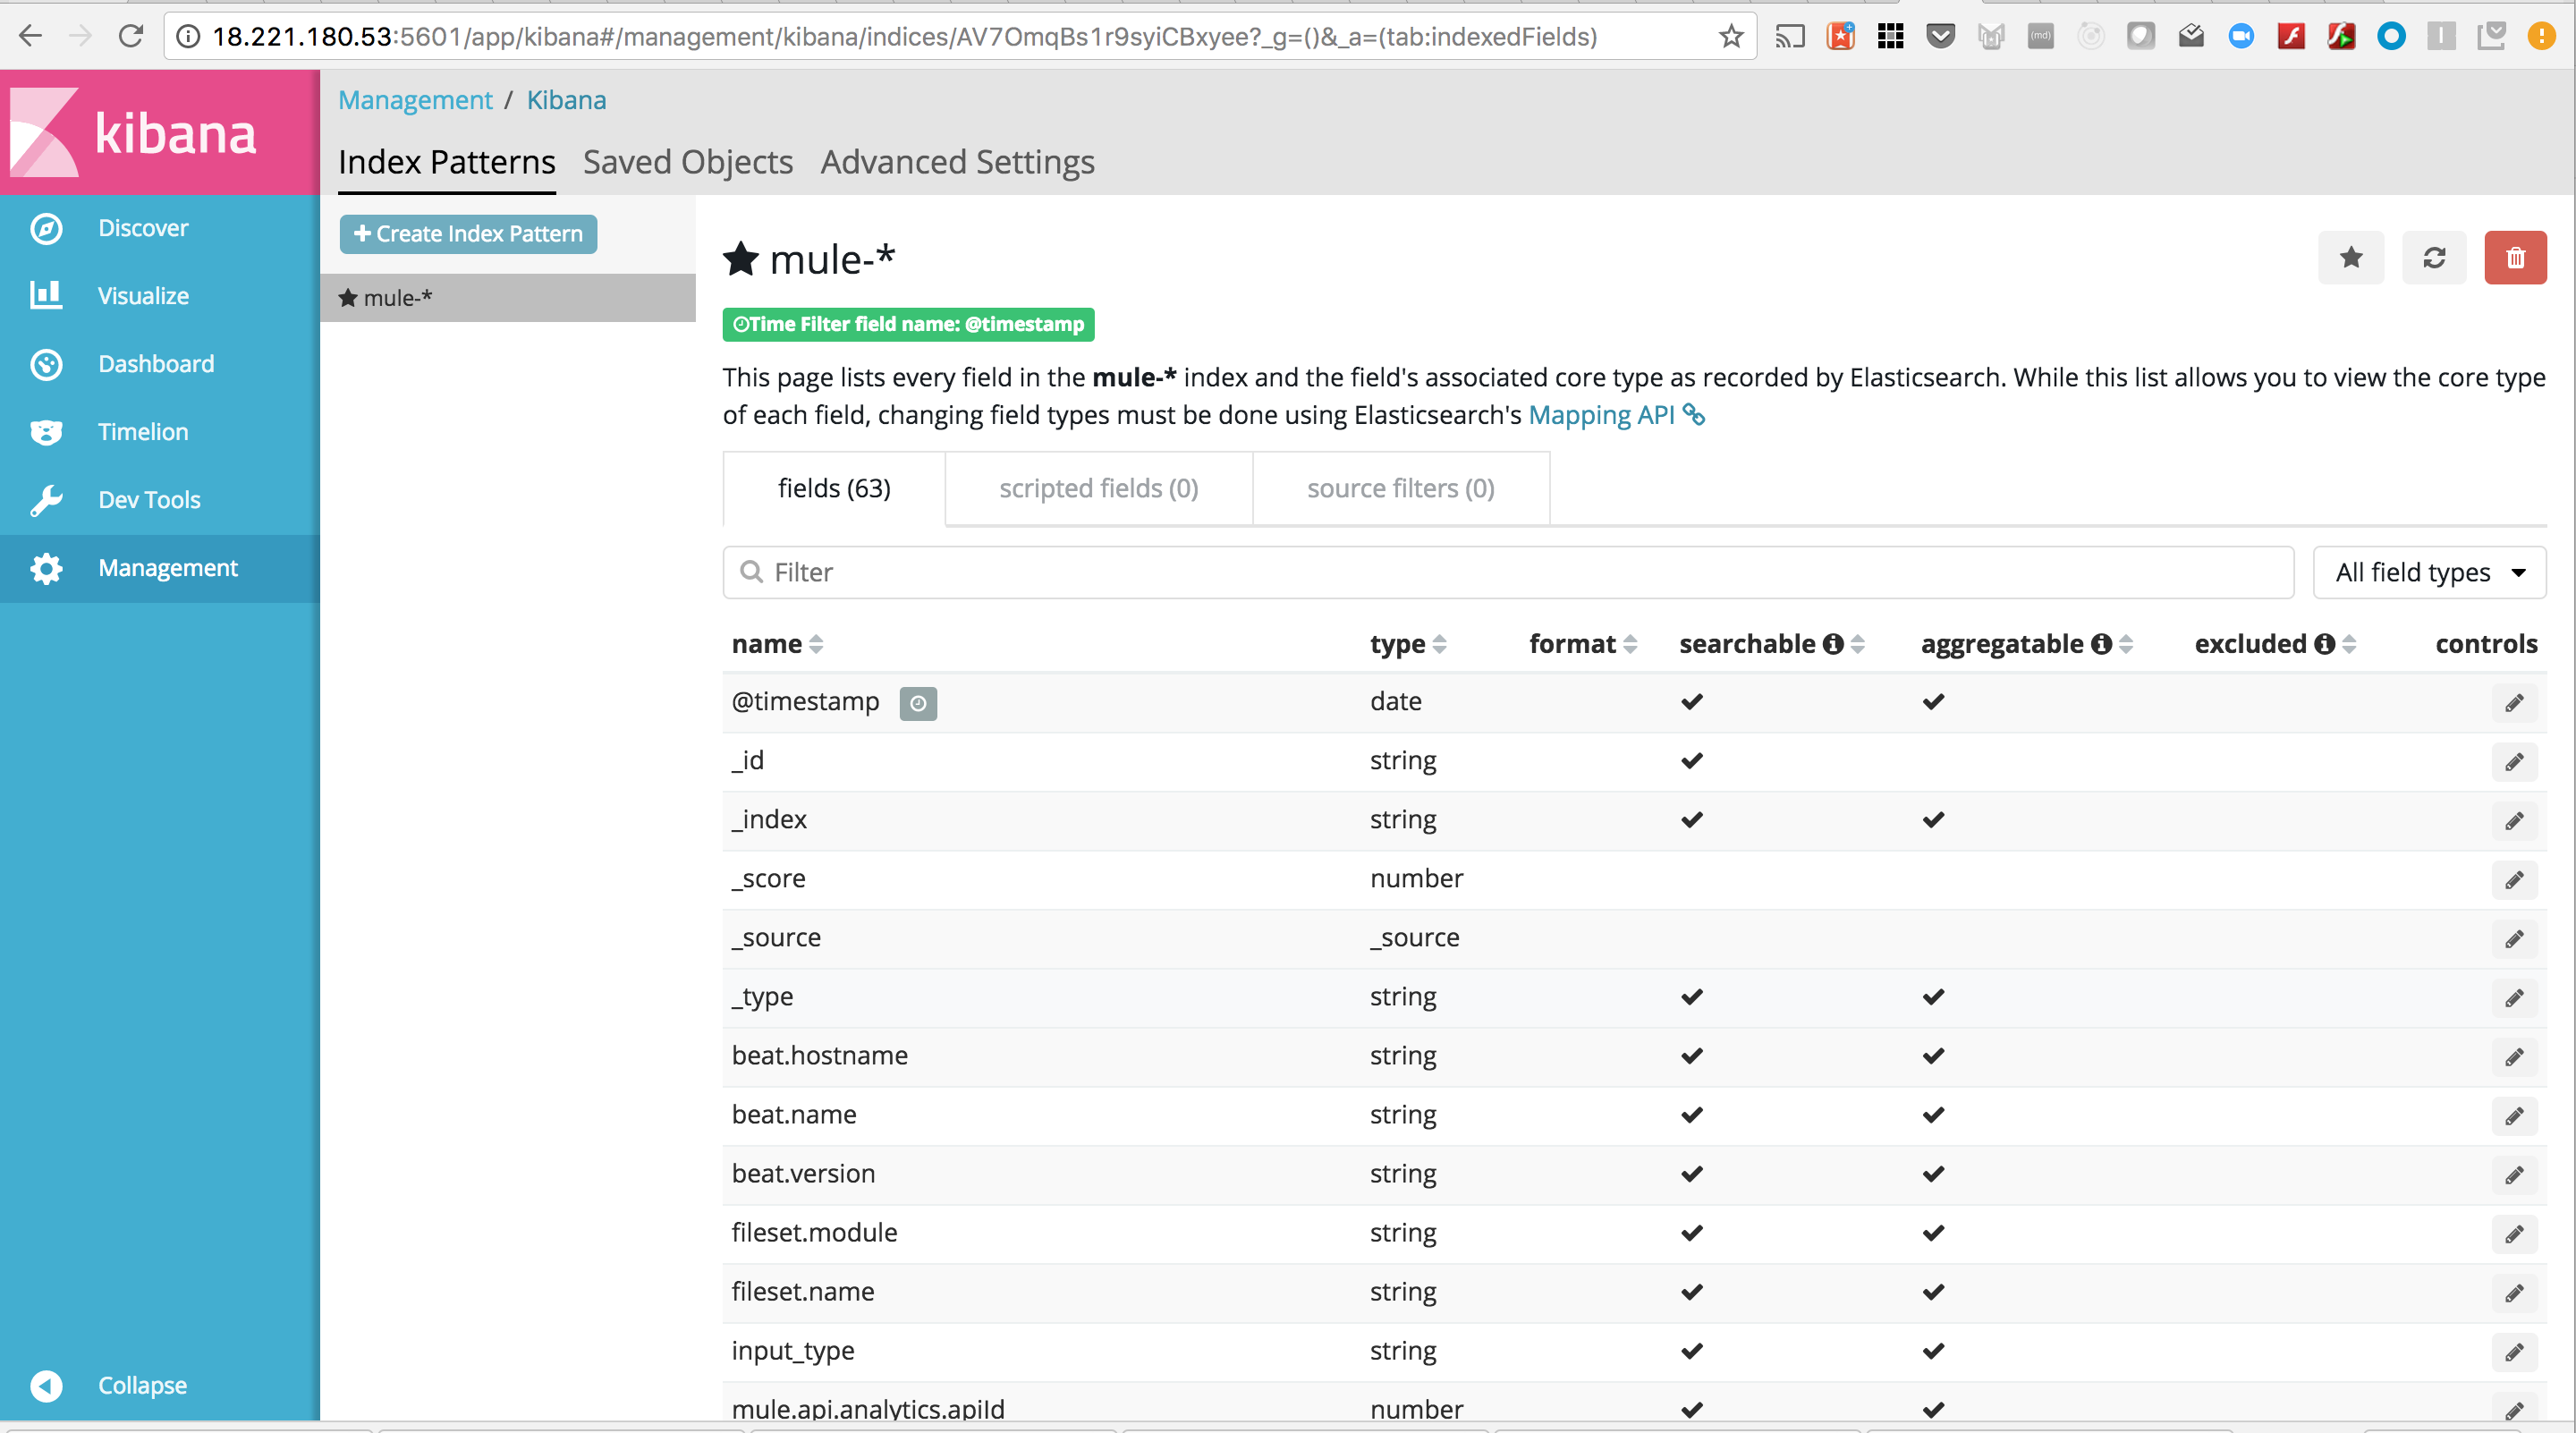
After creating the index pattern, you must obtain the index ID. This pattern is visible in the URL when viewing the
mule-*index pattern. For example, in the following image the index pattern ID isAV7OmqBs1r9syiCBxyee.
-
Download the Mule Kibana configuration files from the following URL:
https://s3.us-east-2.amazonaws.com/elk-integration/elk-integration-09-29-17/dashboards.tar.gz
This file contains a default dashboard, search, and visualization dashboards that you can use to analyze Anypoint Platform data.
-
Add the Index Pattern ID to the
searchSourceJSONProperty ofsearches.json.Modify
searches.jsonto include the index pattern ID retrieved in a previous step. You must modify every occurrence ofsearchSourceJSONin this file."kibanaSavedObjectMeta": { "searchSourceJSON": "{\"index\":\"AV7OmqBs1r9syiCBxyee\", ....... } -
Import each of the dashboards into your Kibana installation.
You must import the dashboards in the following order:
-
dashboards.json
-
searches.json
-
visualizations.json
-


