Mule Debugger View Reference
This section contains a full description of the Mule Debugger View and all its available tools.
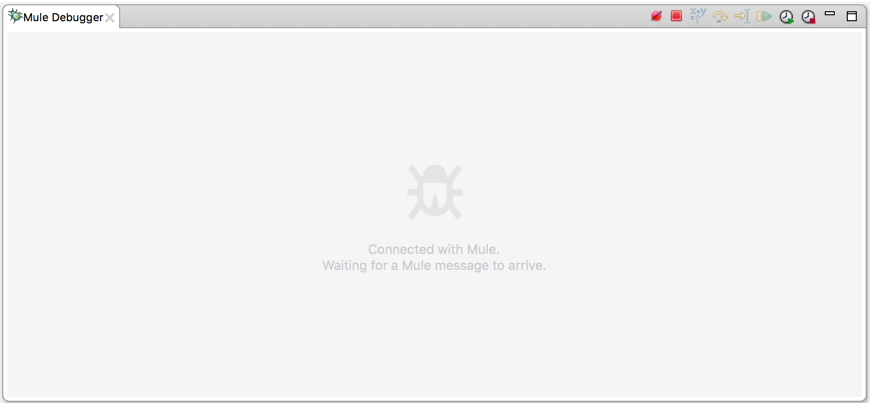
When the Mule Debugger starts, it points at the running Mule Runtime in Studio and waits for the Mule Event to reach its first active breakpoint.
Until then, the Mule Debugger View displays a placeholder message:
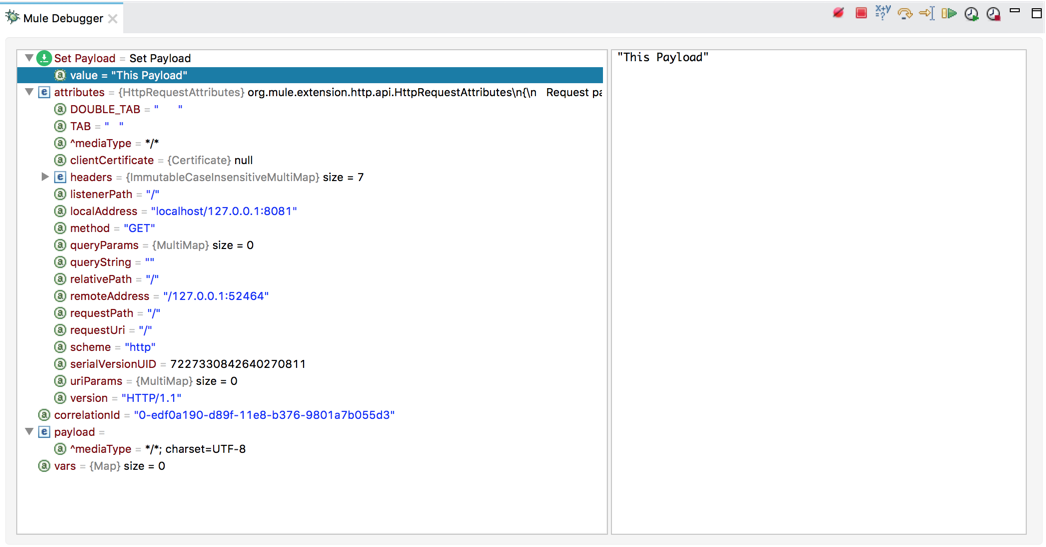
When the Mule Event stops at a Breakpoint, the Mule Debugger View displays information about the state of the Mule Event at that breakpoint:
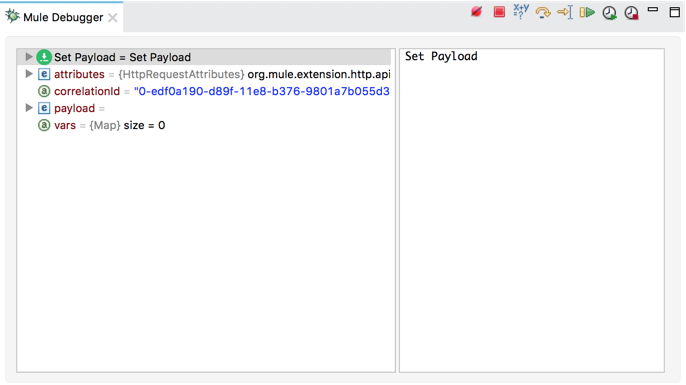
To see any nested elements for a property, click the arrow next to the property name.
You can interact with your inspected element by right-clicking the element on your debugger view to display a contextual menu.
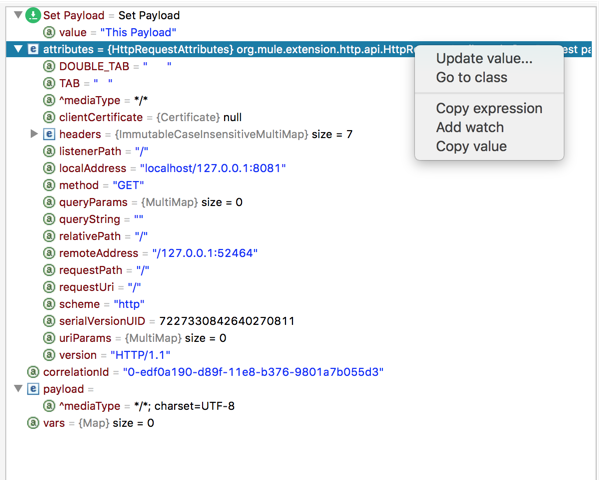
| Value | Description |
|---|---|
Update Value |
Enables you to modify data on the fly to test flows. |
Go to class |
Opens the selected class. |
Copy expression |
Copies the Dataweave expression used to access the value (e.g.: payload.0.filename). |
Add watch |
Automatically adds a new watch with the expression to access the value to the Watches menu. |
Copy value |
Copies the Dataweave expression representing the structure of the selected object. |
On the top right corner of the Mule Debugger View, you can find execution control tools for the Mule Debugger.
| Icon | Name | Description | Shortcut |
|---|---|---|---|
|
Mute Breakpoints |
Click to mute all the marked breakpoints. |
|
|
Terminate |
Click to stop the currently running application. |
|
|
Evaluate Dataweave Expression |
Click to evaluate a Dataweave expression. |
Linux and Windows: |
|
Next Processor |
Click to run the application and stop at the next Event Processor in the flow, even if there is no breakpoint at the next processor. |
|
|
Run to Processor |
Click to run the application and stop at the currently selected processor, even if there is no breakpoint at the currently selected processor. Emulates the behavior of the "Run to cursor" option in Java debuggers. (To select a processor, single-click its building block in the canvas.) |
|
|
Resume |
Click to run the application until the next breakpoint, if any. |
|
|
Start Scheduler |
When configuring a Scheduler in your Mule application, this option triggers the scheduler according to the frequency set in the poll scope. |
|
|
Stop Scheduler |
When configuring a Scheduler in your Mule application, this option it stops the initiated Scheduler. This function only works if the Scheduler has been initiated using the Start Scheduler button above. |
