Customizing the Management Console Dashboard
Customizable Dashboard
When you close the Quick Start dashboard, which summarizes and provides links to the tasks you perform through the console, you have a completely customizable dashboard at your disposal. This dashboard provides summary views of the servers and processing you are monitoring and can be customized to meet your particular needs.
This customizable dashboard displays a set of data panels (referred to as portlets) that give you a broad picture of the health of all your servers, applications, and flows.
[mmc:Mule3.2] The dashboard also displays portlets that indicate the status of your clusters as well as the status of applications deployed to clusters.
Click the Dashboard tab at any time to quickly scan the important aspects of the state of your system.
The default Quick Start dashboard display may work perfectly well for you and you can leave it as is. Or, you can easily customize the dashboard for your specific needs. You can add or remove the different portlets that display the various metrics reflecting the health of your system. You can also rename portlets, customize the display within each portlet, and reposition portlets within the dashboard itself.
Viewing the Custom Dashboard
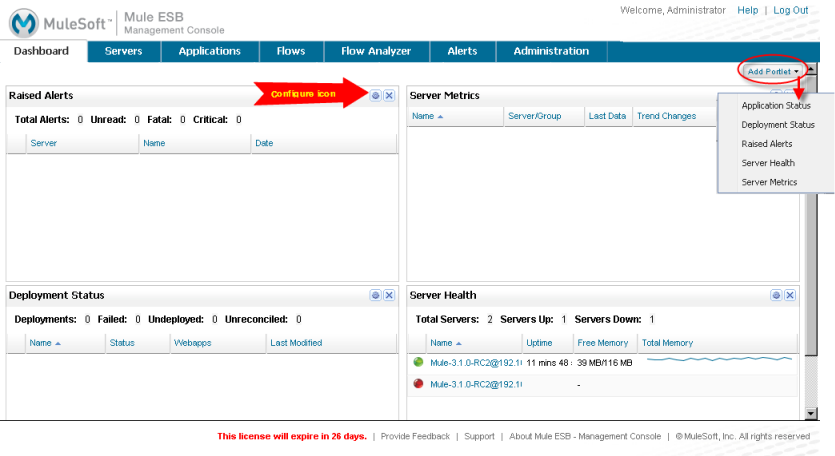
Click the X at the top right of the Quick Start screen, or check the "don’t show this panel again" box at the bottom, to see the customizable dashboard itself, shown in the figure below.)
Customizing the Dashboard Display
Each data panel in the dashboard (Server Health, Raised Alerts, Application Status, Deployment Status, and Server Metrics) is considered to be a portlet. To display a particular portlet, click the Add Portlet button and click those portlets you want displayed. Click the X icon in the title bar of a portlet you want removed from the dashboard display.
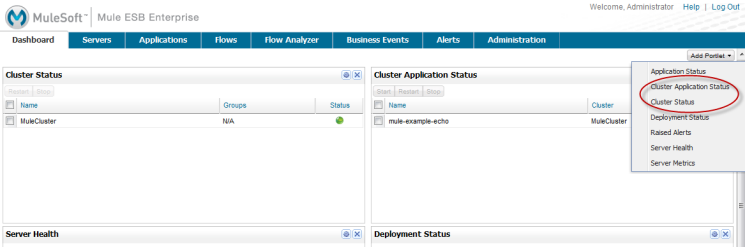
[mmc:Mule3.2] Two cluster-related portlets – Cluster Status and Cluster Application Status – are also available, as shown in the following figure:
The table below shows the portlets that you can display on the dashboard, plus the customizable options for each portlet. Since you can change the display name for all portlets, this option is not shown.
| Default Portlet Name | Options |
|---|---|
Raised Alerts |
Server Group |
Deployment Status |
Server Group |
Server Health |
Server Group |
Application Status |
Server Group |
Server Metrics |
Server Group and Chart Types |
[mmc:Mule 3.2] Cluster Status |
Server Group |
[mmc:Mule 3.2] Cluster Application Status |
Server Group |
Note that you can have more than one version of the same portlet displayed on the dashboard. For example, you might want two Server Metrics portlets to appear and have each portlet display a different metric chart. (See Customizing the Server Metrics Dashboard for more information on the server dashboard metrics charts and customizing them.)
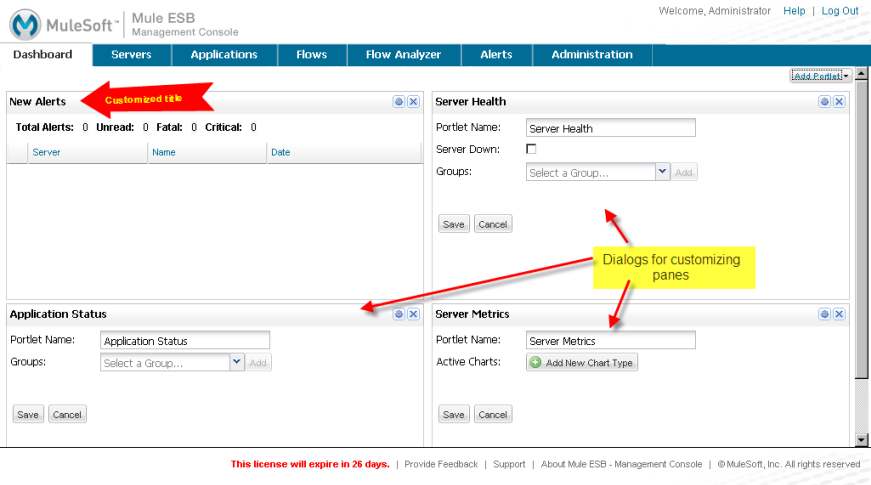
Click the customize icon (marked in the figure above) in the portlet title bar to customize that particular portlet. A dialog appears in the portlet, and you have options such as entering a new name for the portlet title bar, selecting the groups (of servers) for the display data, changing metric charts, and so forth. To keep your changes, click Save.
For example, in the figure below, the Deployment Status portlet was closed and replaced with the Application Status portlet. In addition, the Raised Alerts title bar was changed to New Alerts. The figure also shows three of the dialogs for customizing the portlets.
When you add a portlet to the dashboard, by default the portlet appears at the bottom left side of the screen. (You may have to scroll down to see the portlet.) Reposition portlets on the screen as follows. Grab the title bar of the portlet with your mouse (hover the mouse over the title bar area until crossed arrows appear, then click and hold the mouse button) and drag it to a new location. The screen displays a blue shadow and blue dotted lines indicating the location where it will place the portlet when you release the mouse button.
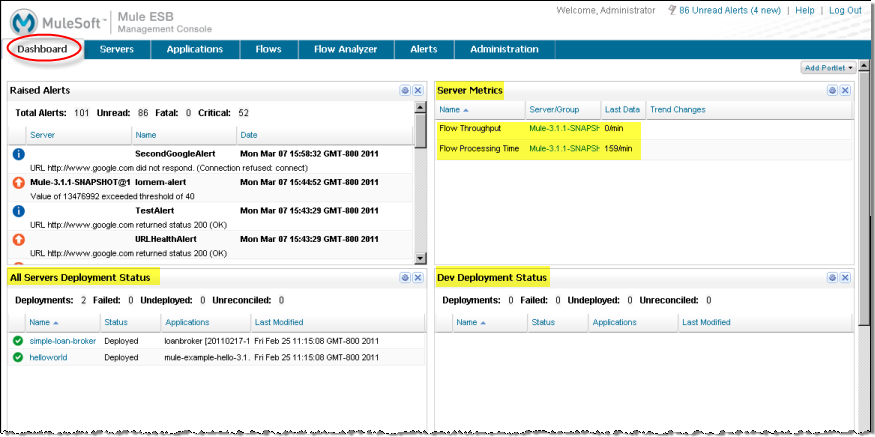
The figure below is another example of a customized dashboard. In this example, the Server Metrics portlet has been changed to show Flow Throughput and Flow Processing Time trends only. Plus, there are two deployment status portlets. One shows the deployment status for deployments on all registered servers (renamed to All Servers Deployment Status) and the other shows only deployments on servers in the development group (renamed Dev Deployment Status).