Customizing the Server Metrics Dashboard
Click the configure icon to the right of the Servers Metrics heading (in the figure below) to customize this portion of the servers details pane. You can select the particular metrics you want displayed in the chart.
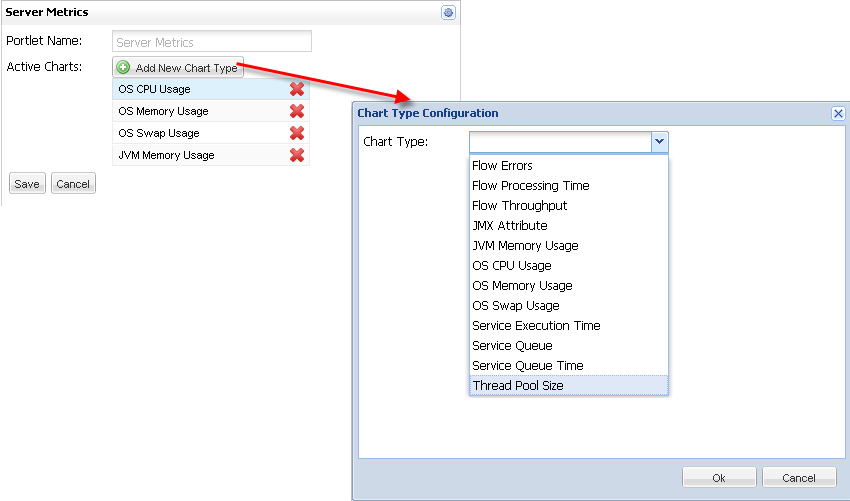
The customize screen (in the figure below) shows the active metrics, which are those currently appearing in the pane. Click the red X next to a metric to remove it from the display. For example, click the X to the right of OS Swap Usage to remove it from the chart.
Click the Add New Chart Type button to select other usage charts to display. Select from the available list of charts.
Depending on the chart you select, you may be queried for more information. For example, if you select the Service Execution Time chart, you are prompted to select a service from the pull-down list. You can also customize the display name for the chart. See the figure below.
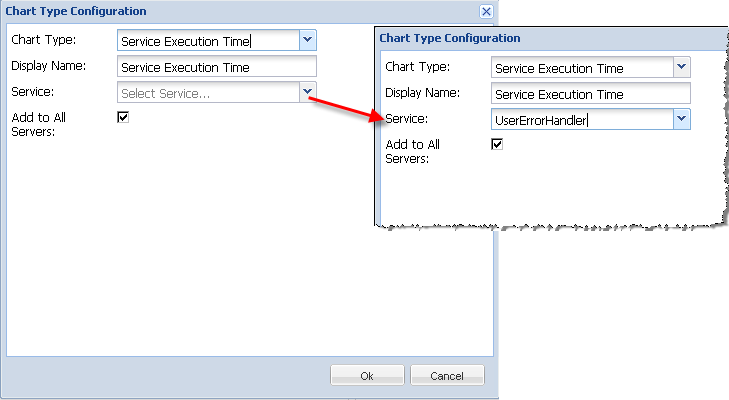
Chart Configuration Options
You can add the following server metrics charts. For each type of chart, the table shows the configuration you will need to specify. Since you may configure the display name for any chart type, this option is not shown in the table. In addition, you can add the server metrics chart to all servers.
| Chart Type | Configuration Options |
|---|---|
Flow Errors |
Select the flow |
Flow Processing Time |
Select the flow |
Flow Throughput |
Select the flow |
JMX Attribute |
MBean, attribute, period (in seconds), Track Delta |
JMX Memory Usage |
Maximum memory, select memory pool |
OS CPU Usage |
No additional options |
OS Memory Usage |
Maximum memory |
OS Swap Usage |
Maximum memory |
Service Execution Time |
Select the service |
Service Queue |
Select the service |
Service Queue Time |
Select the service |
Thread Pool Size |
Select the thread pool |