Monitoring a Server
This page provides an overview of how system administrators can use the management console for Mule ESB to monitor the health of a server, see which flows and services are running or stopped, and determine memory usage.
[mmc:Mule 3.2] You can also use the management console to monitor a cluster. A cluster is a set of Mule instances that acts as a unit. See Monitoring a Cluster for details.
Viewing All Servers
Click the Servers tab to view the summary screen showing all current servers. From this screen, you click individual servers to drill down for more information about them.
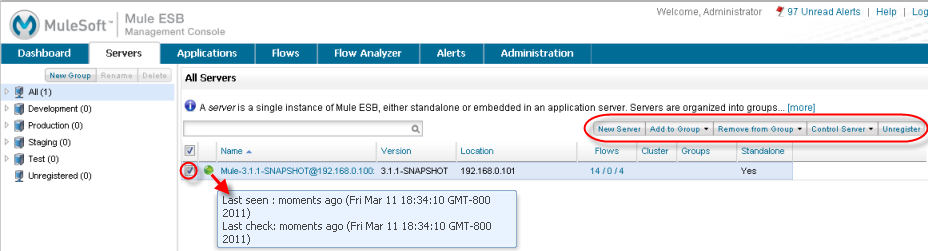
The circle to the left of the server name, green in the figure above, indicates whether or not the server is currently running. A green circle indicates that the server is running, whereas a red circle indicates that the server is stopped. Hover your mouse over the circle to see a status message about the server.
Click a server’s checkbox to perform actions on that server via the function buttons. For a selected server, you can use the buttons and their pull-down lists to:
-
Add to Group: Add the server to a server group.
-
Remove from Group: Remove the server from a server group.
-
Control Server: Stop or Restart the server.
-
Unregister: Unregister the server from the console. If you unregister a server, a dialog box appears and asks you to confirm the operation.
To see detailed information about a particular server, click the server name in the Servers pane. The Server Details Dashboard screen opens and displays summary information about the selected server. Use the other tabs from the Servers pane to see details on alerts, memory usage, threads, pool usage, and so forth. These panes are described in the pages that follow.
Viewing Individual Servers
Use the Servers details dashboard pane to get an overview and detailed information, including OS version information and uptime since the last restart, about individual servers. The figure below shows the Dashboard pane with summary details about a selected server.
From this pane, click any of the server-specific tabs to view more information about this server, including deployed applications, alerts, memory usage, plus information about threads, pools, files, server properties, OS resources, JMX, and server settings.
Note that you can also click a deployment name (such as examples1 in the figure below) in the Deployment Status pane to view details about this deployment group. If you do, you can easily return to the servers screen by clicking the back arrow. (You can get to the same deployment information screen by also clicking the Applications tab in the topmost toolbar; see Deploying Applications for more details on managing application deployment.)
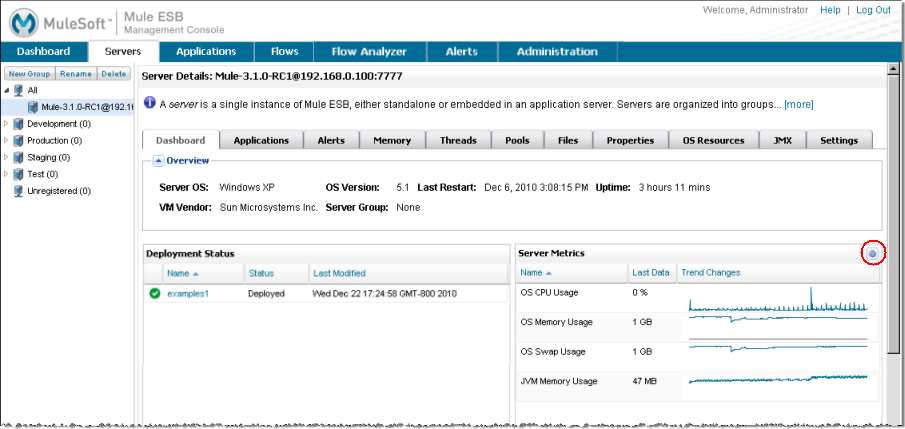
You can customize the panes that display for a server. You do so by clicking the icon circled in the figure above. You can add additional panes (also called portlets) and add to or change the server metrics charts. For information on customizing these panes, see Customizing Server Metrics Dashboard.
Note About Alerts
|
Defining and Viewing Alerts You can view alerts from two places: either from the top-level Alerts tab, where you also define alerts, or from the Alerts tab for a specific server. The top-level Alerts tab lets you add new alerts and view existing alerts, whereas from the Servers tab, you can see alerts set for one or more servers. However, to see alerts from the Servers tab, you must first select the server of interest, then click the server’s Alerts tab. (The figure below highlights these two tabs.) |
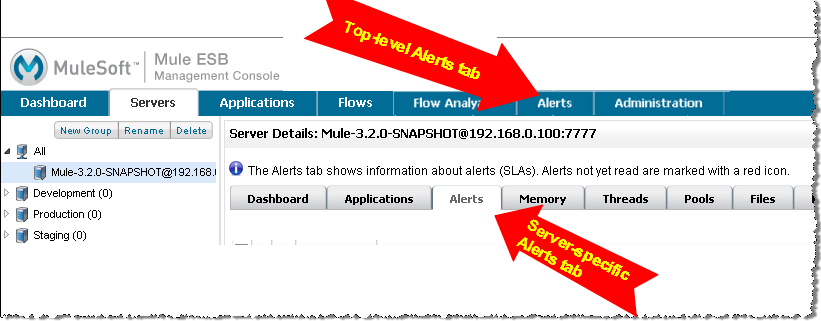
See the Working With Alerts page for more details on defining and managing alerts. Viewing server-specific alerts is covered in Viewing Server Alerts.