Viewing System Memory
The Memory tab shows how much memory is being used by each memory pool in the JVM where this instance of Mule ESB is running. The tables at the top of the tab show real-time statistics for each memory pool, and the charts at the bottom provide a graphical view of the statistics, illustrating memory usage over time. Click a chart to zoom in for a more granular view, or to zoom out.
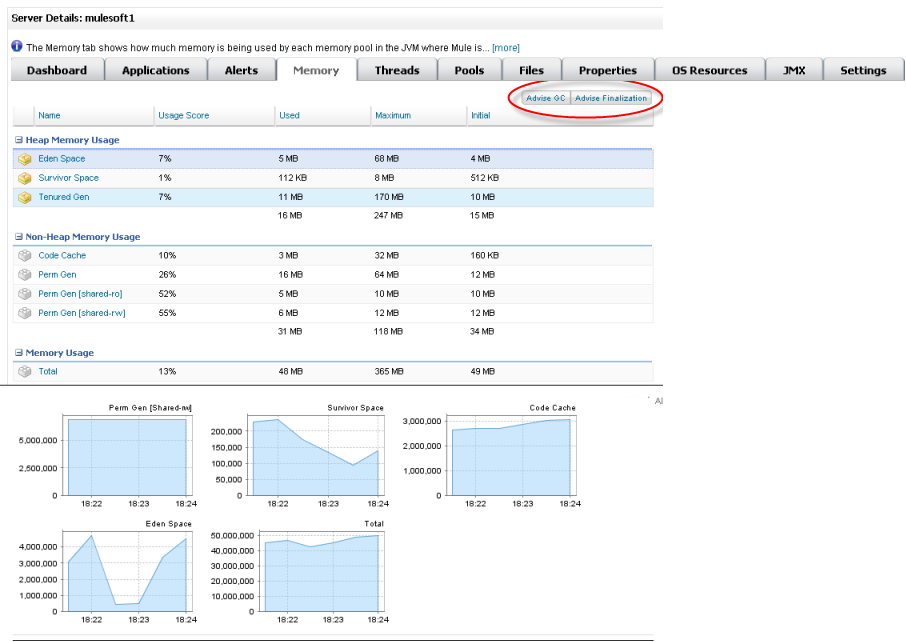
The tables group the memory pools by heap memory, non-heap memory, and total memory. Each table includes the following columns:
-
Name: the name of the memory pool, which you can click to zoom in on its chart. The memory pools are as follows:
-
Eden Space is the initial memory pool for most objects.
-
Survivor Space contains objects that have survived Eden space garbage collection.
-
Tenured Gen contains long-lived objects.
-
Code Cache contains memory for compiling and storing native code.
-
Perm Gen contains reflective data for the JVM itself, including class and memory objects.
-
-
Usage Score: How accurate the memory requirement was compared to the actual memory usage
-
Used: The amount of memory used by this memory pool
-
Maximum: The maximum amount of memory that can be used by this pool
-
Initial: The initial amount of memory requested from the JVM for this pool
In a test environment, you can click Advise GC to run System.gc(), which advises the JVM to perform garbage collection to release memory taken up by objects no longer in use. Alternatively, you can click Advise Finalization, which runs System.runFinalization(), to suggest running finalization methods on objects. Because they can cause a pause in application execution or freeze the JVM, be especially careful about using these two functions in a production environment.