Viewing Threads
The Threads tab allows you to view the threads that are running in the JVM. The information displayed depends on whether the server’s JVM has the JMX agent installed or is based on the thread class. The thread class view displays less-detailed information, so if you need more details, you should consider installing a JMX agent. To enable the JMX agent with Tomcat, add the -Dcom.sun.management.jmxremote option to your CATALINA_OPTS setting.
The figure below is an example of a threads display.
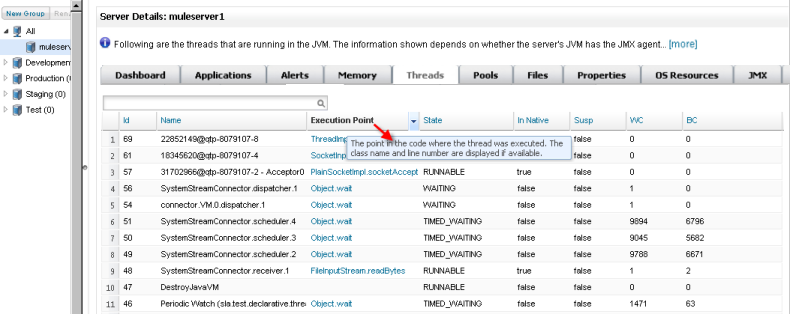
The pane shows all threads on the selected server. The columns in the table show the following information about each thread. (Note that if you hover the mouse over a column name, a brief explanation of the column’s data pops up. For example, the figure above shows the pop-up for the Execution Point column.)
-
Name: Threads are identified by name.
-
Execution Point: The point in the code at which the thread is executing. If appropriate, the class name and line number are also displayed.
-
State: The current state of the thread, such as Runnable, Waiting, and so forth.
-
In Native: Indicates whether the thread is executing in native code.
-
Susp: Indicates whether the thread is suspended.
-
WC: The Waited Count, which indicates the number of times the thread has been waiting.
-
BC: The Blocked Count, which is the number of times the thread has been blocked from entering a monitor. A block typically occurs when a thread must wait to enter a synchronized block.
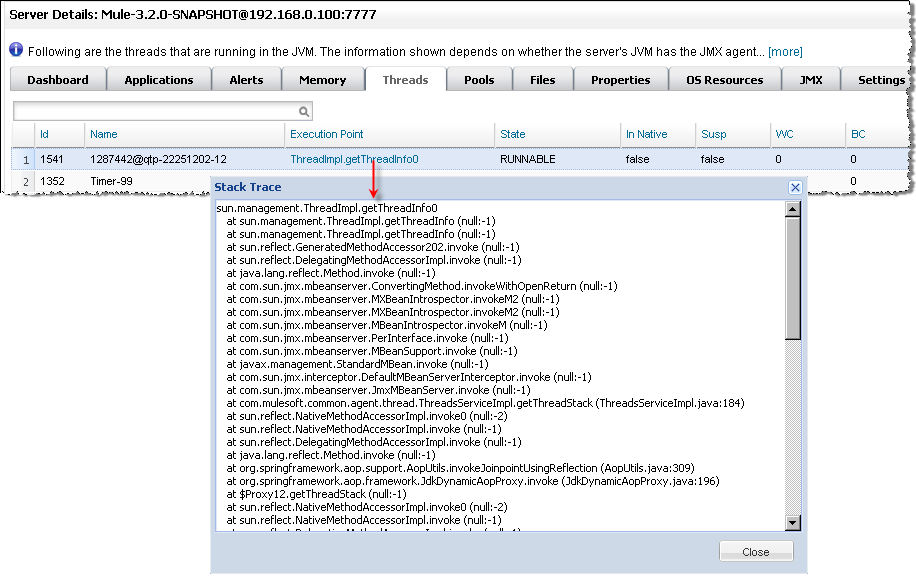
Note that if you click on a thread’s execution point, a window pops up and displays the current stack trace. This window is scrollable and can be moved and repositioned, if need be.